This is a guest post from Jiebin Sun, Zhiguo Zhou, Wangyang Guo and Tianyou Li, performance optimization engineers at Intel Shanghai.
Intel's latest processor generations are pushing the number of cores in a server to unprecedented levels - from 128 P-cores per socket in Granite Rapids to 288 E-cores per socket in Sierra Forest, with future roadmaps targeting 200+ cores per socket. These numbers multiply on multi-socket systems, such servers may consist of 400 and more cores. The paradigm of "more, not faster cores" is driven by physical limitations. Since the end of Dennard scaling in the mid-2000s, power density concerns made it increasingly difficult to push single-thread performance further.
For analytical databases like ClickHouse, ultra-high core counts represent a huge opportunity and a complex challenge at the same time. While more cores theoretically mean more power to process tasks in parallel, most databases struggle to utilize the available hardware fully. Bottlenecks for parallel processing like lock contention, cache coherence, non-uniform memory access (NUMA), memory bandwidth, and coordination overhead become significantly worse as the core count increases.
Over the past three years, I dedicated a part of my professional life to understand and optimize ClickHouse's scalability on Intel Xeon ultra-high core count processors. My work focused on using various profiling and analysis tools - including perf, emon, and Intel VTune - to analyze all 43 ClickBench queries on ultra-high core count servers systematically, identifying bottlenecks, and optimizing the ClickHouse accordingly.
The results have been exciting: individual optimizations routinely deliver speedups of multiple times for individual queries, in some cases up to 10x. The geometric mean of all 43 ClickBench queries consistently improved between 2% and 10% per optimization. The results demonstrate that ClickHouse can be made scale very well on ultra-high core count systems.
Beyond single-thread performance, several key challenges must be addressed to optimize performance in ultra-high core count systems.
- Cache coherence overhead: Bouncing cache lines costs CPU cycles.
- Lock contention: Amdahl's Law becomes brutal for serialized code sections as little as 1% of the overall code.
- Memory bandwidth: Utilizing the memory bandwidth effectively is a persistent challenge for data-intensive systems. Proper memory reuse, management and caching becomes critical.
- Thread coordination: The cost of synchronizing threads grows super-linearly with the number of threads.
- NUMA effects: The memory latency and bandwidth on multi-socket systems differs for local or remote memory.
This blog post summarizes our optimizations for ClickHouse on ultra-high core count servers. All of them were merged into the main codeline and they now help to speed up queries in ClickHouse deployments around the globe.
Hardware setup: Our work was conducted on Intel's latest generation platforms, including 2 x 80 vCPUs Ice Lake (ICX), 2 x 128 vCPUs Sapphire Rapids (SPR), 1 x 288 vCPUs Sierra Forest (SRF), and 2 x 240 vCPUs Granite Rapids (GNR). SMT (Hyper-threading) was enabled, except on SRF which doesn't support SMT, and high-memory-bandwidth configurations.
Software setup: We used perf, Intel VTune, pipeline visualization, and other custom profiling infrastructure.
Through a systematic analysis of ClickHouse's performance on ultra-high core count systems, I identified five areas with a high potential for optimization. Each area addresses a different aspect of scalability, and together they form a comprehensive approach to unlocking the full potential of ultra-high core count systems.
My journey began with the most fundamental challenge: lock contention.
Bottleneck 1: Lock contention
According to queue theory, if N threads compete for the same lock, the cycles grows quadratically (N^2). For example, if we go from 8 to 80 cores, lock wait times increase by (80/8)² = 100x. Furthermore, cache coherence traffic for the mutex itself grows linearly with the core count, and the overhead for context switching compounds the problem. In such settings, every mutex becomes a potential scalability obstacle, and seemingly innocent synchronization patterns can bring entire systems to their knee.
The key insight is that lock contention isn't just about removing locks - it's about rethinking more fundamentally how threads coordinate and share state. This requires a multi-pronged approach: reducing the duration of critical sections, replacing exclusive locks (mutexes) with more granular synchronization primitives, and in some cases, eliminating shared state entirely.
After resolving jemalloc page faults (an optimization detailed below), a new hotspot appeared in native_queued_spin_lock_slowpath which consumed 76% of the CPU time. This function was called from QueryConditionCache::write on 2×240 vCPU systems.
What is the query condition cache?
ClickHouse’s query condition cache stores the results of WHERE filters, enabling the database to skip irrelevant data. In each SELECT query, multiple threads check if cache entries must be updated based on different criteria:
- the hash of the filter condition (as cache key)
- the read mark ranges
- whether the currently read part has a final mark
The query condition cache is read-heavy, i.e. there are far more reads than writes, but the original implementation used exclusive locking for all operations.
Reducing critical paths in read-heavy workloads
This optimization demonstrates the importance of reducing the time spent holding locks, especially write locks in read-heavy code.
With 240 threads within a single query, the original code created a perfect storm:
- Unnecessary write locks: All threads acquired exclusive locks, even when they only read cache entries.
- Long critical sections: Expensive updates of cache entries were performed inside exclusive locks.
- Redundant work: Multiple threads updated the same cache entries potentially multiple times.
Our optimization uses double-checked locking with atomic operations to resolve these bottlenecks:
- The code now first checks with atomic reads (no locking), respectively under a shared lock if an update is needed at all (fast path).
- Next, the code checks immediately after acquiring an exclusive lock (slow path) if an update is actually required - another thread may have performed the same update in the meantime.
Implementation
Based on PR #80247, the optimization introduces a fast path which checks if an update is needed before acquiring the expensive write lock.
/// Original code
void updateCache(mark_ranges, has_final_mark)
{
    acquire_exclusive_lock(cache_mutex);  /// 240 threads wait here!

    /// Always update marks, even if already in desired state
    for (const auto & range : mark_ranges)
        set_marks_to_false(range.begin, range.end);

    if (has_final_mark):
        set_final_mark_to_false();

    release_lock(cache_mutex);
}


/// Optimized code
void updateCache(mark_ranges, has_final_mark)
{
    /// Fast path: Check if update is needed with a cheap shared lock
    acquire_shared_lock(cache_mutex);  /// Multiple threads can read simultaneously

    need_update = false;
    for (const auto & range : mark_ranges)
    {
        if (any_marks_are_true(range.begin, range.end))
        {
            need_update = true;
            break;
        }
    }

    if (has_final_mark && final_mark_is_true())
        need_update = true;

    release_shared_lock(cache_mutex);

    if (!need_update)
        return;  /// Early out - no expensive lock needed!

    /// Slow path: Actually need to update, acquire exclusive lock
    acquire_exclusive_lock(cache_mutex);

    /// Double-check: verify update is still needed after acquiring lock
    need_update = false;
    for (const auto & range : mark_ranges)
    {
        if (any_marks_are_true(range.begin, range.end))
        {
            need_update = true;
            break;
        }
    }

    if (has_final_mark && final_mark_is_true())
        need_update = true;

    if (need_update)
    {
        // Perform the actual updates only if still needed
        for (const auto & range : mark_ranges)
            set_marks_to_false(range.begin, range.end);

        if (has_final_mark)
            set_final_mark_to_false();
    }

    release_lock(cache_mutex);
}
Performance impact
The optimized code delivered impressive performance improvements:
- CPU cycles spend for
native_queued_spin_lock_slowpathreduced from 76% to 1% - The QPS of ClickBench queries Q10 and Q11 improved by 85% and 89%
- The geometric mean of all ClickBench queries improved by 8.1%
ClickHouse's query profiler was frequently creating and deleting a global timer_id variable, causing lock contention during query profiling.
Query profiler timer usage
ClickHouse's query profiler uses POSIX timers to sample thread stacks in periodic intervals for performance analysis. The original implementation:
- created and deleted timer_id frequently during profiling, and
- required global synchronization for all operations that read or write the timer.
Usage of shared data structures that needed protection with locks caused significant overhead.
Eliminating global state with thread-local storage
Here, we eliminated lock contention by thread-local storage, removing the need for shared state. Now, each thread has its own timer_id. This avoids shared state and the overhead of thread synchronization. To update a timer, it is no longer required to acquire locks.
Technical solution
/// Original code
class QueryProfiler
{
    static global_mutex timer_management_lock

    void startProfiling()
    {
        timer_id = create_new_timer();  /// Expensive system call

        acquire_exclusive_lock(timer_management_lock);  /// Global lock!
        update_shared_timer_state(timer_id);  /// Modify shared state
        release_lock(timer_management_lock);
    }

    void stopProfiling()
    {
        acquire_exclusive_lock(timer_management_lock);
        cleanup_shared_timer_state(timer_id);
        release_lock(timer_management_lock);

        delete_timer(timer_id);
    }
}


/// Optimized code
class QueryProfiler
{
    static thread_local timer_id per_thread_timer;
    static thread_local boolean timer_initialized;

    void startProfiling()
    {
        if (!timer_initialized)
        {
            per_thread_timer = create_new_timer();  /// Once per thread
            timer_initialized = true;
        }

        /// Reuse existing timer - no locks, no system calls!
        enable_timer(per_thread_timer);
    }

    void stopProfiling()
    {
        /// Just disable timer - no deletion, no locks!
        disable_timer(per_thread_timer);
    }
}
Performance impact
The new implementation has the following advantages:
- It eliminated timer-related lock contention hotspots from profiling traces
- It reduced timer create/delete system calls through reuse
- It makes profiling on ultra-high core count servers more scalable.
Thread-local storage can eliminate lock contention by removing the need for shared state. Global synchronization becomes unnecessary if threads maintain their own state.
Memory optimization on ultra-high core count systems differs a lot from single-threaded memory management. Memory allocators themselves become contention points, memory bandwidth is divided across more cores, and allocation patterns that work fine on small systems can create cascading performance problems at scale. It is crucial to be mindful of how much memory is allocated and how memory is used.
This class of optimizations involves the allocator’s behavior, reducing pressure on memory bandwidth, and sometimes completely rethinking algorithms to eliminate memory-intensive operations altogether.
This optimization is motivated by high page fault rates and excessive resident memory usage which we observed for certain aggregation queries on ultra-high core count systems.
Understanding two-level hash tables in ClickHouse
Aggregation in ClickHouse uses different hash tables, depending on the data type, data distribution and data size. Large aggregation states are maintained in ephemeral hash tables.
- The 1st level consists of 256 static buckets, each pointing to a 2nd level hash table.
- 2nd level hash tables grow independently of each other.
Memory reuse for two-level hash tables
At the end of an aggregation query, all hash tables used by the query are deallocated. In particular, the 256 sub-hash tables are deallocated and their memory is merged into larger free memory blocks.
jemalloc (as ClickHouse’s memory allocator) unfortunately prevented the reuse of merged memory blocks for future smaller allocations. This is because by default, only memory from blocks up to 64x larger than the requested size can be reused. This issue in jemalloc is very subtle but critical on ultra-high core count systems.
Based on jemalloc issue #2842, we noticed a fundamental problem with jemalloc’s memory reuse for the irregularly-sized allocations typical in two-level hash tables:
- Extent management issue: When large allocations are freed, jemalloc fails to efficiently track and reuse these memory extents.
- Size class fragmentation: Memory gets trapped in size classes that don't match future allocation patterns.
- Metadata overhead: Excessive metadata structures prevent efficient memory coalescing.
- Page fault amplification: New allocations trigger page faults instead of reusing existing committed pages.
We identified jemalloc's lg_extent_max_active_fit parameter as the root cause - it was too restrictive for ClickHouse's allocation patterns.
We contributed the fix to jemalloc PR #2842, but jemalloc didn’t have new stable releases for an extended period. Fortunately, we could resolve this issue through jemalloc's configuration parameters at compilation time.
Based on ClickHouse PR #80245, the fix involved tuning jemalloc's configuration parameters:
/// Original jemalloc configuration
JEMALLOC_CONFIG_MALLOC_CONF = "oversize_threshold:0,muzzy_decay_ms:0,dirty_decay_ms:5000"
/// lg_extent_max_active_fit defaults to 6, meaning memory can be reused from extents up to 64x larger than the requested allocation size


/// Optimized jemalloc configuration
JEMALLOC_CONFIG_MALLOC_CONF = "oversize_threshold:0,muzzy_decay_ms:0,dirty_decay_ms:5000,lg_extent_max_active_fit:8"
/// lg_extent_max_active_fit is set to 8.
/// This allows memory reuse from extents up to 256x larger
/// than the requested allocation size (2^8 = 256x vs default 2^6 = 64x).
/// The 256x limit matches ClickHouse's two-level hash table structure (256 buckets).
/// This enables efficient reuse of merged hash table memory blocks.
Performance impact
The optimization improved
- the performance of ClickBench query Q35 by 96.1%,
- memory usage (VmRSS, resident memory) and page faults reduced for the same query went down by 45.4% and 71%, respectively.
The behavior of the memory allocator can have a dramatic impact on ultra-high core count systems.
ClickBench query Q29 was memory-bound and bottlenecked in excessive memory accesses caused by redundant computations of the form sum(column + literal).
Understanding the memory bottleneck
ClickBench query Q29 contains multiple sum expressions with literals:
SELECT SUM(ResolutionWidth), SUM(ResolutionWidth + 1), SUM(ResolutionWidth + 2),
       SUM(ResolutionWidth + 3), SUM(ResolutionWidth + 4), SUM(ResolutionWidth + 5),
       SUM(ResolutionWidth + 6), SUM(ResolutionWidth + 7), SUM(ResolutionWidth + 8),
       SUM(ResolutionWidth + 9), SUM(ResolutionWidth + 10), SUM(ResolutionWidth + 11),
       SUM(ResolutionWidth + 12), SUM(ResolutionWidth + 13), SUM(ResolutionWidth + 14),
       SUM(ResolutionWidth + 15), SUM(ResolutionWidth + 16), SUM(ResolutionWidth + 17),
       SUM(ResolutionWidth + 18), SUM(ResolutionWidth + 19), SUM(ResolutionWidth + 20),
       -- ... continues up to SUM(ResolutionWidth + 89)
FROM hits;
The original query execution
- Loaded column “ResolutionWidth” from storage once,
- Compute expressions - 90 times, creating 90 temporary columns (one per expression),
- Sum values performing 90 separate aggregation operations on each computed column.
Creating 90 temporary columns and running 90 redundant aggregations obviously created massive memory pressure.
Frontend query optimization for memory efficiency
This optimization demonstrates how better optimizer rules can reduce memory pressure by eliminating redundant computations. The key insight is that many analytical queries contain patterns that can be algebraically simplified.
The optimization recognizes that sum(column + literal) can be rewritten to sum(column) + count(column) * literal.
Performance impact
- ClickBench query Q29 sped up by 11.5x on a 2×80 vCPU system.
- The geometric mean of all ClickBench queries saw a 5.3% improvement overall.
More intelligent query plans can be more effective than optimizing execution itself. Avoiding work is better than doing work efficiently.
Fast aggregation is a core promise of any analytical database. From a database perspective, aggregating data in parallel threads is only one part of the equation. It is equally important to merge the local results in parallel.
ClickHouse's aggregation operator has two phases: In the first phase, each thread processes its portion of the data in parallel, creating a local and partial result. In the second phase, all partial results must be merged. If the merge phase is not properly parallelized, it becomes a bottleneck. More threads can actually make this issue worse by creating more partial results to merge.
Solving this issue requires careful algorithm design, smart data structure choices, and a deep understanding how hash tables behave under different load patterns. The goal is to eliminate the serial merge phase and enable linear scaling even for the most complex aggregation queries.
ClickBench query Q5 showed a severe performance degradation as the core count increased from 80 to 112 threads. Our pipeline analysis revealed serial processing in the hash table conversion.
Understanding hash tables in ClickHouse
ClickHouse uses two types of hash tables for hash aggregation:
- Single-level hash tables: This is a flat hash table that is suitable (= faster) for smaller datasets.
- Two-level hash tables: This is a hierarchical hash table with 256 buckets. Two-level hash tables are more amendable to large datasets.
The database chooses the right hash table type based on the size of the processed data: Once a single-level hash table reaches a certain threshold during aggregation, it is automatically converted to a two-level hash table. The code to merge hash tables of different types was serialized.
The serial bottleneck
When merging hash tables from different threads,
- single-level hash tables were serially merged in a pair-wise manner, e.g. ht1 / ht2 → result, then result / ht3, etc.
- two-level hash tables are merged one-by-one as well but the merge is parallelized across buckets.
In the case of mixed single/two-level hash tables, the single-level hash tables had to be converted to two-level hash tables first (this was a serial process). Once the was done, the resulting two-level hash tables could be merged in parallel.
With Q5, increasing the number of threads from 80 to 112 meant that each thread processes less data. With 80 threads, all hash tables were two-level. With 112 threads, the aggregation ended up with the mixed scenario: some hash tables remained single-level while others became two-level. This caused serialization - all single-level hash tables had to be converted to two-level before parallel merging could take place.
To diagnose the issue, pipeline visualization was a crucial tool. The telltale sign was that the merge phase duration increased with thread count - this is the opposite of what should happen.
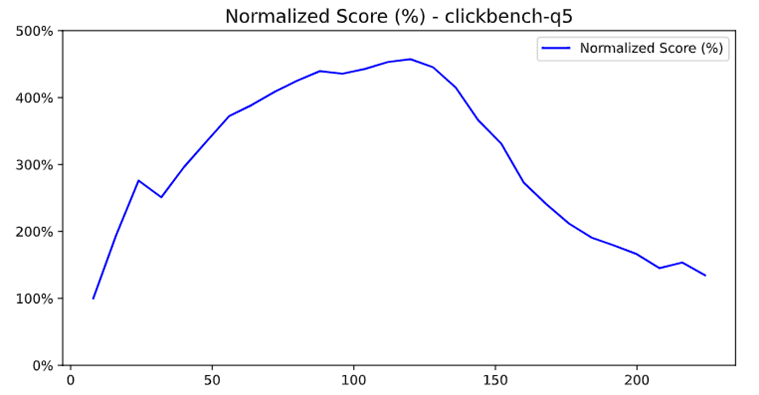
Performance degradation with increased core count
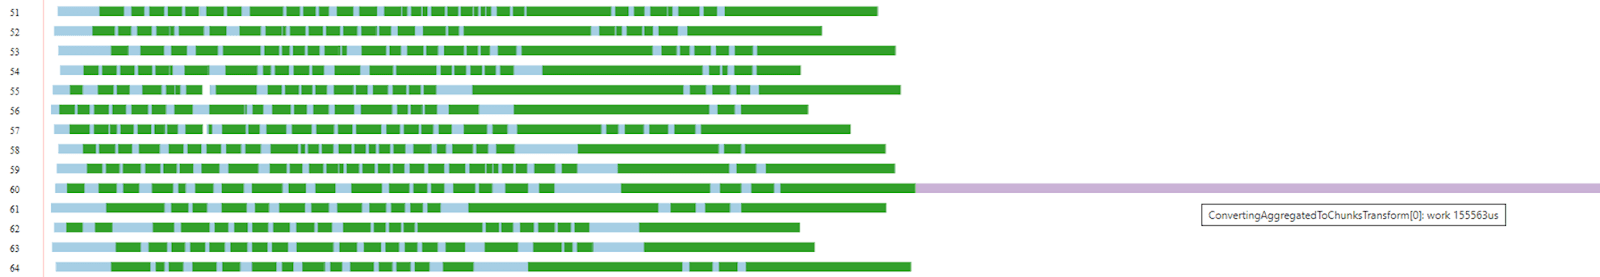
Pipeline visualization (max_threads=80) - the merge phase is reasonable
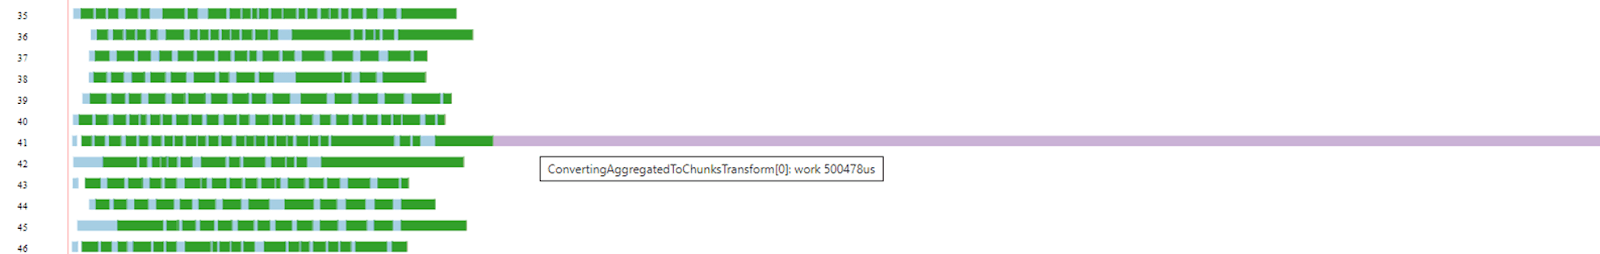
Pipeline visualization (max_threads=112) - the merge phase takes 3.2x longer
Our optimization parallelizes the conversion phase: instead of converting all single-level hash tables to two-level hash tables one by one (serially), we now convert them in parallel. As each hash table can be converted independently, this eliminates the serial bottleneck.
/// Original code
void mergeHashTable(left_table, right_table)
{
    if (left_table.is_single_level() && right_table.is_two_level())
        left_table.convert_to_two_level();  /// Serial conversion blocks threads

    /// Now merge
    merge_sets(left_table, right_table);
}


/// Optimized code
void mergeHashTableParallel(all_tables)
{
    /// Phase 1: Parallel conversion
    parallel_tasks = [];
    for (const auto & table : all_tables)
    {
        if (table.is_single_level())
        {
            /// Parallel conversion!
            task = create_parallel_task(table.convert_to_two_level());
            parallel_tasks.add(task);
        }
    }

    /// Wait for all conversions to complete
    wait_for_all_tasks(parallel_tasks);

    /// Phase 2: Now all sets are two-level, merge efficiently.
    for (const auto & pair : all_tables)
        merge_sets(pair.left_table, pair.right_table);
}
Performance impact
The performance did not improve only for Q5 - the optimization enabled linear scaling for any aggregation-heavy query on ultra-high core count systems.
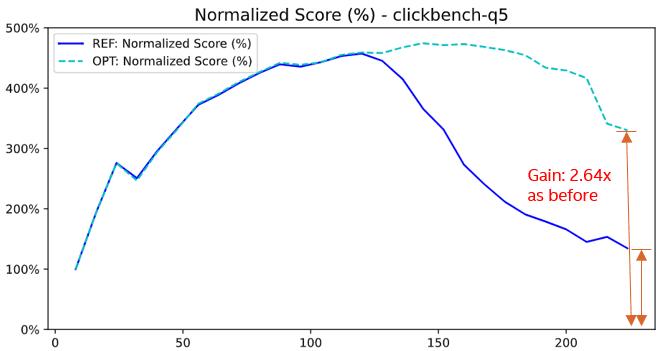
Performance improvement after parallel conversion - Q5 achieves 264% improvement
- ClickBench query Q5 improved by a 264% on a 2×112 vCPU system,
- 24 queries achieved >5% improvement,
- the overall geometric mean improved by 7.4%
The optimization demonstrates that scalability isn't just about making things more parallel - it's about eliminating serial sections that grow with parallelism. Sometimes you need to restructure algorithms on a more deep level, not just add more threads.
We noticed that the performance was also subpar when all hash tables were single-level.
Extending parallel merge to single-level cases
Building on PR #50748, this optimization recognizes that the benefits of parallel merging are not limited to mixed hash tables. Even when all hash tables are single-level, parallel merging can improve performance if the total data size is large enough.
The challenge was to determine when single-level hash tables should be merged in parallel parallel:
- If datasets are too small, parallelization introduces extra overhead.
- If datasets are too large, parallelization may not be beneficial enough.
Based on the implementation in PR #52973, the optimization added parallel merges to all single-level cases:
/// Before: Only parallelize mixed-level merges
void parallelizeMergePrepare(hash_tables)
{
    single_level_count = 0;

    for (const auto & hash_table : hash_tables)
        if hash_table.is_single_level():
            single_level_count++;

    /// Only convert if mixed levels (some single, some two-level)
    if single_level_count > 0 and single_level_count < hash_tables.size():
        convert_to_two_level_parallel(hash_tables);
}


/// Optimized code
void parallelizeMergePrepare(hash_tables):
{
    single_level_count = 0;
    all_single_hash_size = 0;

    for (const auto & hash_table : hash_tables)
        if (hash_table.is_single_level())
            single_level_count++

    /// Calculate total size if all hash tables are single-level
    if (single_level_count == hash_tables.size())
        for (const auto & hash_table : hash_tables)
            all_single_hash_size += hash_table.size();

    /// Convert if mixed levels OR if all single-level with average size > THRESHOLD
    if (single_level_count > 0 and single_level_count < hash_tables.size())
        ||
       (all_single_hash_size / hash_tables.size() > THRESHOLD)
        convert_to_two_level_parallel(hash_tables);
}
Performance impact
- Performance for single-level merge scenarios improved by 235%
- The optimal threshold was determined through systematic testing
- There were no regressions on small datasets
GROUP BY operations with large hash tables were merged serially.
Extending parallelization to keyed aggregations
The previous two optimizations (3.1 and 3.2) addressed merges without key - simple hash table operations like COUNT(DISTINCT). We applied the same optimization to merges with key where hash tables contain both keys and aggregated values that must be combined, e.g. general GROUP BY semantics.
Performance Impact:
- ClickBench query Q8 improved by 10.3%, Q9 by 7.6%
- There were no regressions in other queries
- CPU utilization during the merge phase improved
Parallel merging can be extended to complex aggregation scenarios with careful attention to cancellation and error handling.
Harnessing the full potential of SIMD instructions is notoriously difficult. Compilers are conservative about vectorization, and database workloads often have complex control flows that inhibit auto-vectorization.
Effective usage of SIMD instructions in databases requires thinking beyond traditional vectorization. Besides processing N data items simultaneously instead of one, one can also utilize parallel SIMD comparisons for smart pruning strategies which lead to less work done overall. This idea is particularly powerful for string operations. These are at the same time frequently used in practice and computationally expensive.
String search (e.g. plain substring search or LIKE pattern search) is a bottleneck in a lot of queries, for example in ClickBench query Q20.
Understanding string search in analytical queries
Clickbench query 20 evaluates a LIKE pattern on millions of URLs, making fast string search crucial.
SELECT COUNT(*) FROM hits WHERE URL LIKE '%google%'
Reducing false positives with two-character filtering
PR #46289 is based on the insight that SIMD instructions can be used in a smart way beyond brute-force parallelization. The original code already leveraged SIMD instructions but it only considered the search pattern’s first character, leading to expensive false positives. We rewrite the code to check the second character as well. This improved selectivity dramatically while adding only a negligible amount of new SIMD operations.
/// Original code
class StringSearcher
{
    first_needle_character = needle[0];
    first_needle_character_vec = broadcast_to_simd_vector(first_needle_character);

    void search()
    {
        for (position in haystack; step by 16 bytes)
        {
            haystack_chunk = load_16_bytes(haystack + position);
            first_matches = simd_compare_equal(haystack_chunk, first_needle_character_vec);
            match_mask = extract_match_positions(first_matches);

            for (const auto & match : match_mask)
                /// High false positive rate - many expensive verifications
                if (full_string_match(haystack + match_pos, needle))
                    return match_pos;
        }
    }
}


// Optimized code
class StringSearcher
{
    first_needle_character = needle[0];
    second_needle_character = needle[1];  /// Second character
    first_needle_character_vec = broadcast_to_simd_vector(first_needle_character);
    second_needle_character_vec = broadcast_to_simd_vector(second_needle_character);

    void search()
    {
        for (position : haystack, step by 16 bytes)
        {
            haystack_chunk1 = load_16_bytes(haystack + position);
            haystack_chunk2 = load_16_bytes(haystack + position + 1);

            /// Compare both characters simultaneously
            first_matches = simd_compare_equal(haystack_chunk1, first_needle_character_vec);
            second_matches = simd_compare_equal(haystack_chunk2, second_needle_character_vec);
            combined_matches = simd_and(first_matches, second_matches);

            match_mask = extract_match_positions(combined_matches);

            for (const auto & match : match_mask)
                // Dramatically fewer false positives - fewer expensive verifications
                if full_string_match(haystack + match_pos, needle):
                    return match_pos;
        }
    }
}
Performance impact
Two-character SIMD filtering improved performance significantly:
- ClickBench query Q20 sped up by 35%
- Other queries which perform substring matching saw an overall improvement of ~10%
- The geometric mean of all queries improved by 4.1%
The performance improvements are a result of fewer false positives, better cache locality and more efficient branch prediction.
Two-character SIMD filtering demonstrates that effective SIMD optimization isn't just about processing more data per instruction - it's about using SIMD's parallel comparison capabilities to improve the algorithmic efficiency. The two-character approach shows how a small number of additional SIMD operations can in some cases yield massive performance gains.
False sharing occurs when multiple threads access variables in the same cache. The CPU's cache coherence protocol works at cache line granularity, meaning that any cache line modifications - including modifications of two different variables - are treated as conflicts which require expensive synchronization between cores. On a 2 x 240 vCPUs system, false sharing can turn simple counter increments into system-wide performance disasters.
Eliminating false sharing requires how CPU cache coherence is implemented at the hardware level. It's not enough to optimize algorithms - to avoid false sharing, one must also optimize the memory layout to make sure that frequently-accessed data structures don't accidentally interfere with each other through cache line conflicts. This involves for example a strategic data layout and use of alignment and padding.
ClickBench query Q3 showed 36.6% of CPU cycles spent in ProfileEvents::increment on a 2×240 vCPU system. Performance profiling revealed a severe cache line contention.
ProfileEvents counters at scale
Profile event counters refer to ClickHouse's internal eventing system - profile events track all internal operations, from detailed query execution steps to memory allocations. In a typical analytical query, these counters are incremented millions of times across all threads. The original implementation organized multiple counters in the same memory region without considering cache line boundaries.
This creates three challenges:
Cache line physics: Modern Intel processors use 64-byte cache lines. When any byte in a cache line is modified, the entire line must be invalidated in the other cores' caches.
False sharing amplification: With 240 threads, each counter update triggers a cache line invalidation across potentially dozens of cores. What should be independent operations become serialized through the cache coherence protocol.
Exponential degradation: As the number of cores increases, the probability of a simultaneous access to the same cache line grows exponentially, compounding the impact of cache misses.
Using perf, I discovered that ProfileEvents::increment was generating massive cache coherence traffic. The smoking gun was the cache line utilization report that showed eight different counters packed into a single cache line. We also added new capabilities to Linux’s perf c2c tool and worked with the community to help developers more easily identify false sharing issues like this.
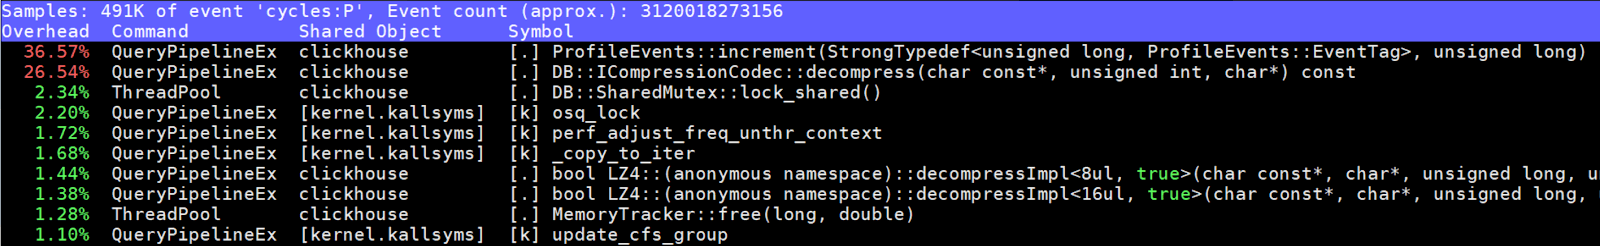
Perf analysis showing 36.6% cycles in ProfileEvents::increment
Proper cache line alignment ensures that each counter gets its own 64-byte cache line. This transforms false sharing (bad) into true sharing (manageable). When a thread updates its counter, now only a single cache line wil be affected.
Based on our implementation in PR #82697, the fix improved the cache line alignment for the profile event counters:
// Before: Counters packed without alignment
struct ProfileEvents:
    atomic_value counters[NUM_EVENTS]  // Multiple counters per cache line
    // 8 counters sharing single 64-byte cache lines

// After: Cache line aligned counters
struct ProfileEvents:
    struct alignas(64) AlignedCounter:
        atomic_value value
        // Padding automatically added to reach 64 bytes

    AlignedCounter counters[NUM_EVENTS]  // Each counter gets own cache line
    // Now each counter has exclusive cache line ownership
Performance impact
This optimization pattern applies to any frequently updated shared and compact data structure. The lesson is that the memory layout becomes critical at scale - what works fine on eight cores can be excruciatingly slow on 240 cores.
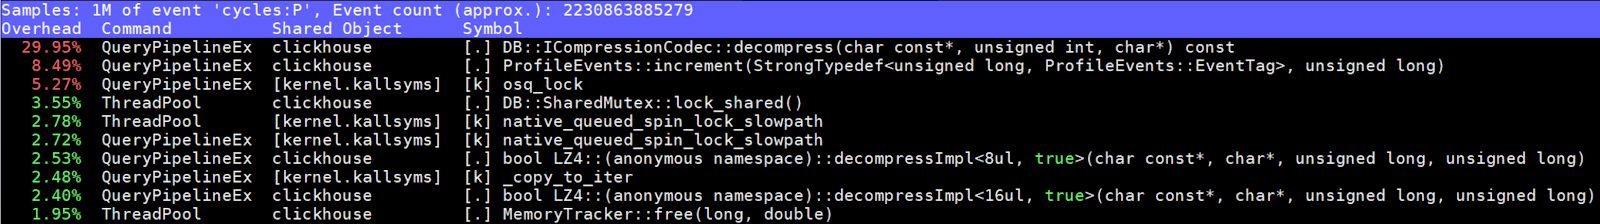
After optimization: ProfileEvents::increment drops to 8.5% (from 36.6%)
As a result of our optimization, ClickBench query Q3 saw a 27.4% improvement on ultra-high core count systems. The performance gain increases with the number of cores because the cache coherence overhead grows super-linearly. This optimization therefore doesn't merely fix a bottleneck - it changes the scalability curve.
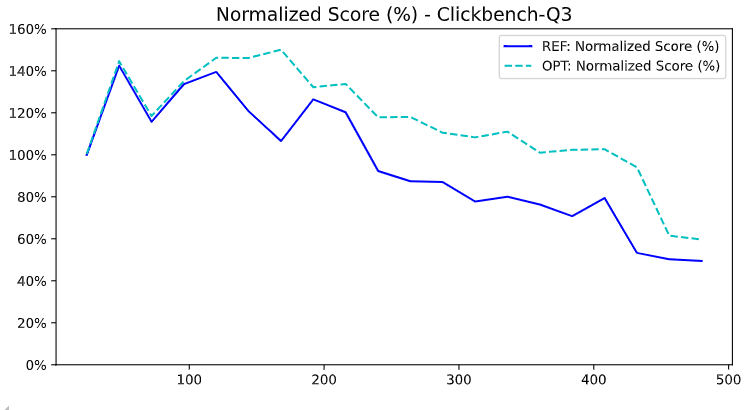
ClickBench Q3: 27.4% improvement, with larger gains on higher core count systems
In this post I covered optimizations for five performance bottlenecks:
- Lock contention - The coordination overhead grows exponentially with core count.
- Memory optimization - The memory bandwidth per core decreases as the core count increases.
- Increased parallelism - Serial phases become the dominant bottleneck.
- SIMD optimization - Smarter algorithms like two-character filtering beyond brute-force vectorization can improve performance significantly.
- False sharing - False sharing is caused by the granularity of cache line size.
The bottlenecks and optimizations presented here are not just about ClickHouse - they represent a fundamental shift in how we must approach database optimization in the ultra-high core count era. As processors continue to evolve toward higher core counts, these techniques will become essential for any system that needs to scale.
Our optimizations enable ClickHouse to achieve close-to-linear scalability as the core count increases. This enables ClickHouse to thrive as an analytics database in a future world where Intel and other hardware manufacturers push the core count into the thousands.

References and Resources
- Source Code: All optimizations available in ClickHouse main branch
- Slide Deck: 2025 Shanghai Meetup Presentation
- Pull Requests: Individual PRs linked throughout this post with detailed performance analysis
- Intel Intrinsics Guide: Intel® Intrinsics Guide
Special thanks to the ClickHouse community for rigorous code review and performance validation. These optimizations represent collaborative effort between Intel and ClickHouse teams to unlock the full potential of modern ultra-high core count processors.
For questions about implementation details or performance reproduction, please refer to the individual PR discussions linked throughout this post.