There's a parallax effect in Street View on Apple Maps that separates out the layers of every image. Things like lampposts or telephone poles all rotate slightly differently to whatever is behind them.
And it's such a subtle effect that I still break my brain trying to determine whether or not I've made it up.
Imagine expending that much development time and effort for something you're not even sure is there. And somehow I still find it enviably cool.
By now we should all be flying around the planet in a seamless 3D reconstruction unifying street level and satellite views and allowing smooth free camera motion all the way from space to the front door of buildings and even inside. Many years ago I saw internal Google demos of dramatically improved Street View rendering, none of which ever made it to production. Google has consistently failed to recognize the value of the product and systematically underinvested in the user experience.
Edit: Apparently it is "Nova Map" base tile set from ArcGIS.
Costa Rica seems also to have more coverage than I see here.
Paraguay too.
The visuals are neat looking but I was hoping to see more details like correlating capture recency with countries, population, economic status, etc. to see what causes areas to get the most and least love from Google.
Source: played a bunch of Kerbal space program
Antarctica is huge (1.5x the area of the US), it would be a dangerous logistical nightmare to fly the sorts of patterns you need to capture aerial imagery there, and it's almost entirely covered in non-descript ice -- what would be the value of having high-resolution imagery there?
We don't. State of the art imaging satellites are in ballpark of 20cm/px.
Here is what antarctica looks from a satellite: https://space-solutions.airbus.com/resources/satellite-image...
Iβm so glad to finally have that feature in my area. It was the one thing I missed from Google Maps which I otherwise avoid.
edit: This page has some data: https://www.researchgate.net/figure/Landscape-metrics-for-ro...
Southern Ontario has 4x the road density of the province average, so might be a contributing factor?
Depending on where you live, that happened about 10 years ago.
El Salvador does have a decent amount of coverage on street view, but this was done by El Salvador Maps (if you pan the camera down, you'll see this name on the cars used to capture the coverage). The dataset is curated by a member of the Geoguessr community, in which "unofficial" coverage like this is disregarded, which is why you won't see it included.
People rarely use the Street View feature because it's difficult to access, and difficult to understand spatially. Free camera motion is impossible and the transitions are jerky and stilted. As a result it's relegated to special places in the UI that are rarely visited. If it was seamlessly integrated into satellite view and directions then it would see much more usage.
I'm rather happy Google maps exists and can't complain too much about using it for free.
Right and if they did you'd likely be complaining about how they ruined Street View by making it a slow bloated mess and should have left it alone.
It makes sense they prototyped it. But putting it into production is $$$, way more expensive than current street view.
Current street view works well enough. How is a massively upgraded 3D version, that is bloated and slower to use on older devices, going to make Google more money?
It feels more like a separate product to license to architecture firms, city planners, video game studios, etc.
Mapillary (https://www.mapillary.com/) has surprisingly good coverage in some places, but the experience is lacking, partly because most of the images (where I've looked) aren't 360 views.
Unfortunately itβs only a small subsets of major cities and the implementation feels so half-baked it could have been an AWS service.
But itβs still a cool tech demo nonetheless.
I think the drift is specifically tied to the introduction of leetcode in the interview process. Which may sound like a wild connection at first but Iβve now lived through being blocked and seeing how creative devs canβt get through leetcode gatekeepers who are microfussing and blanket critiquing devs as bad when they donβt have leetcode answers pre memorized in a mental hasmap to be able to regurgitate from memory which allows the extra mental capacity to free up in order to hold a performative class lecture about it at the same time.
You can spend your time memorizing the test taking skills to be good at tests. Maybe memorize the answers too. Or you can be coming up with grand ideas like maps and street view and thinking about how all these things in the world come together to be able to do that.
Not many are good at both and the entire stack of people doing interviews is currently blocked at fixing this. Nobody wants to have wasted their time memorizing leetcode to just not gatekeep people who didnβt put in βthe same effort,β and no hiring team wants to gamble on somebody who fails the leetcode test processes and turns out to be the occasional bad hire with the only paperwork saying they didnβt pass the industry standard test and shouldnβt have gotten hired in the first place.
So weβre now blocked with only slop workers getting hired who donβt feel the same comfort to take big risks and we get slop like Microsoft notepad plus copilot 365 as a result.
Edit: for those who didn't know, like me, apple's maps are available at https://maps.apple.com. You can see this yourself. The effect is unvelievably smooth compared to what Google maps have
[0] panoramax.openstreetmap.fr/
Finally there is a glimmer of hope now that Android XR is happening. There is a new version of Google Maps for Android XR that does finally have a 3D reconstruction feature for Street View, but only for building interiors. Hopefully it won't be abandoned this time!
Meanwhile they have nearly full coverage of the rest of western Europe, plus a huge amount of Canada and Mexico.
https://i.imgur.com/ZPTozti.png
This was launched in 2019. A few years ago I remember speculating that they were holding it back with the cool 3D effects to do a big push alongside Vision Pro, but that's come and gone with no significant change to Look Around.
California isn't doing bad, but outside of that they're averaging about 0.5 locations per state.
They haven't been to Nashville but they sent someone to drive to Rainbow Lake, Alberta? What gives?
I could see well-mapped street view with good services built around it, and maybe a way to pay for and schedule regular updates, being used for towns to monitor public space long term too.
I think many things could be built on a better street view, but I also don't want Google to get yet another de facto monopoly in a new domain.
Waymo and others already do this, that's why they can only operate in mapped areas.
Given that Waymo is a google company, they almost certainly started with street view data.
I'm fully bought off on the "it would be fun" aspect. I don't see a value proposition for it, though.
Do I think it could be useful if you rehearse navigating a place before getting there? Yeah. Ish. I can see obvious military style value adds for that. Average person, though? I still have a hard time seeing the value.
Reminds me when places were offering video tours of places. Is a neat idea. But ridiculously low in actual value.
Last year, I came across a dataset documenting Google's global Street View coverage. Each point in this dataset includes the year and month of that point's last capture.
In this post, I'll convert this dataset into Parquet and examine its geospatial patterns.
I'm using a 5.7 GHz AMD Ryzen 9 9950X CPU. It has 16 cores and 32 threads and 1.2 MB of L1, 16 MB of L2 and 64 MB of L3 cache. It has a liquid cooler attached and is housed in a spacious, full-sized Cooler Master HAF 700 computer case.
The system has 96 GB of DDR5 RAM clocked at 4,800 MT/s and a 5th-generation, Crucial T700 4 TB NVMe M.2 SSD which can read at speeds up to 12,400 MB/s. There is a heatsink on the SSD to help keep its temperature down. This is my system's C drive.
The system is powered by a 1,200-watt, fully modular Corsair Power Supply and is sat on an ASRock X870E Nova 90 Motherboard.
I'm running Ubuntu 24 LTS via Microsoft's Ubuntu for Windows on Windows 11 Pro. In case you're wondering why I don't run a Linux-based desktop as my primary work environment, I'm still using an Nvidia GTX 1080 GPU which has better driver support on Windows and ArcGIS Pro only supports Windows natively.
I'll use DuckDB v1.4.3, along with its H3, JSON, Lindel, Parquet and Spatial extensions, in this post.
$ cd ~ $ wget -c https://github.com/duckdb/duckdb/releases/download/v1.4.3/duckdb\_cli-linux-amd64.zip $ unzip -j duckdb_cli-linux-amd64.zip $ chmod +x duckdb $ ~/duckdb
INSTALL h3 FROM community; INSTALL lindel FROM community; INSTALL json; INSTALL parquet; INSTALL spatial;
I'll set up DuckDB to load every installed extension each time it launches.
$ vi ~/.duckdbrc
.timer on .width 180 LOAD h3; LOAD lindel; LOAD json; LOAD parquet; LOAD spatial;
The maps in this post were rendered using QGIS version 3.44. QGIS is a desktop application that runs on Windows, macOS and Linux. The application has grown in popularity in recent years and has ~15M application launches from users all around the world each month.
I used QGIS' HCMGIS plugin to add basemaps from Esri to the maps in this post.
The following will download 131 JSON files which are 647 MB uncompressed. These files were last refreshed on December 4th.
$ mkdir -p ~/emily_biz $ cd ~/emily_biz
$ wget -r -A json https://geo.emily.bz/coverage-dates
Below is an example record from one of the JSON files.
$ jq -S \ .customCoordinates[0] \ geo.emily.bz/coverage-dates/aland.json
{ "extra": { "tags": [ "2009-08" ] }, "lat": 60.023421733271704, "lng": 20.58331925203021 }
Below, I'll create a table in DuckDB and import the data from the JSON files.
$ ~/duckdb street_view.duckdb
CREATE OR REPLACE TABLE street_view ( geometry GEOMETRY, updated_at DATE);
$ for FILENAME in geo.emily.bz/coverage-dates/*.json; do echo $FILENAME echo " INSERT INTO street_view WITH a AS ( SELECT UNNEST(customCoordinates) a FROM READ_JSON('$FILENAME')) SELECT geometry: ST_POINT(a.lng, a.lat), updated_at: (a.extra.tags[-1] || '-01')::DATE FROM a WHERE a.extra.tags[-1] LIKE '2%'" \ | ~/duckdb street_view.duckdb done
I'll then export this table as a spatially-sorted, ZStandard-compressed Parquet file.
$ ~/duckdb street_view.duckdb
COPY ( FROM street_view ORDER BY HILBERT_ENCODE([ST_Y(ST_CENTROID(geometry)), ST_X(ST_CENTROID(geometry))]::double[2]) ) TO 'street_view.parquet' ( FORMAT 'PARQUET', CODEC 'ZSTD', COMPRESSION_LEVEL 22, ROW_GROUP_SIZE 15000);
The resulting Parquet file is 85 MB and contains 7,163,407 rows.
Data for Bosnia and Herzegovina, Cyprus, Namibia, Paraguay and Vietnam are missing in this release. Hopefully, they will be available after the next refresh.
Below are the point counts rounded up to the nearest thousand and broken down by year.
$ ~/duckdb
SELECT year: YEAR(updated_at), count: CEIL((COUNT(*) / 1000))::INT, FROM 'street_view.parquet' GROUP BY 1 ORDER BY 1;
βββββββββ¬ββββββββ β year β count β β int64 β int32 β βββββββββΌββββββββ€ β 2003 β 1 β β 2006 β 1 β β 2007 β 28 β β 2008 β 251 β β 2009 β 659 β β 2010 β 344 β β 2011 β 619 β β 2012 β 792 β β 2013 β 622 β β 2014 β 474 β β 2015 β 661 β β 2016 β 529 β β 2017 β 70 β β 2018 β 142 β β 2019 β 195 β β 2020 β 50 β β 2021 β 267 β β 2022 β 507 β β 2023 β 588 β β 2024 β 290 β β 2025 β 83 β βββββββββ΄ββββββββ€ β 21 rows β βββββββββββββββββ
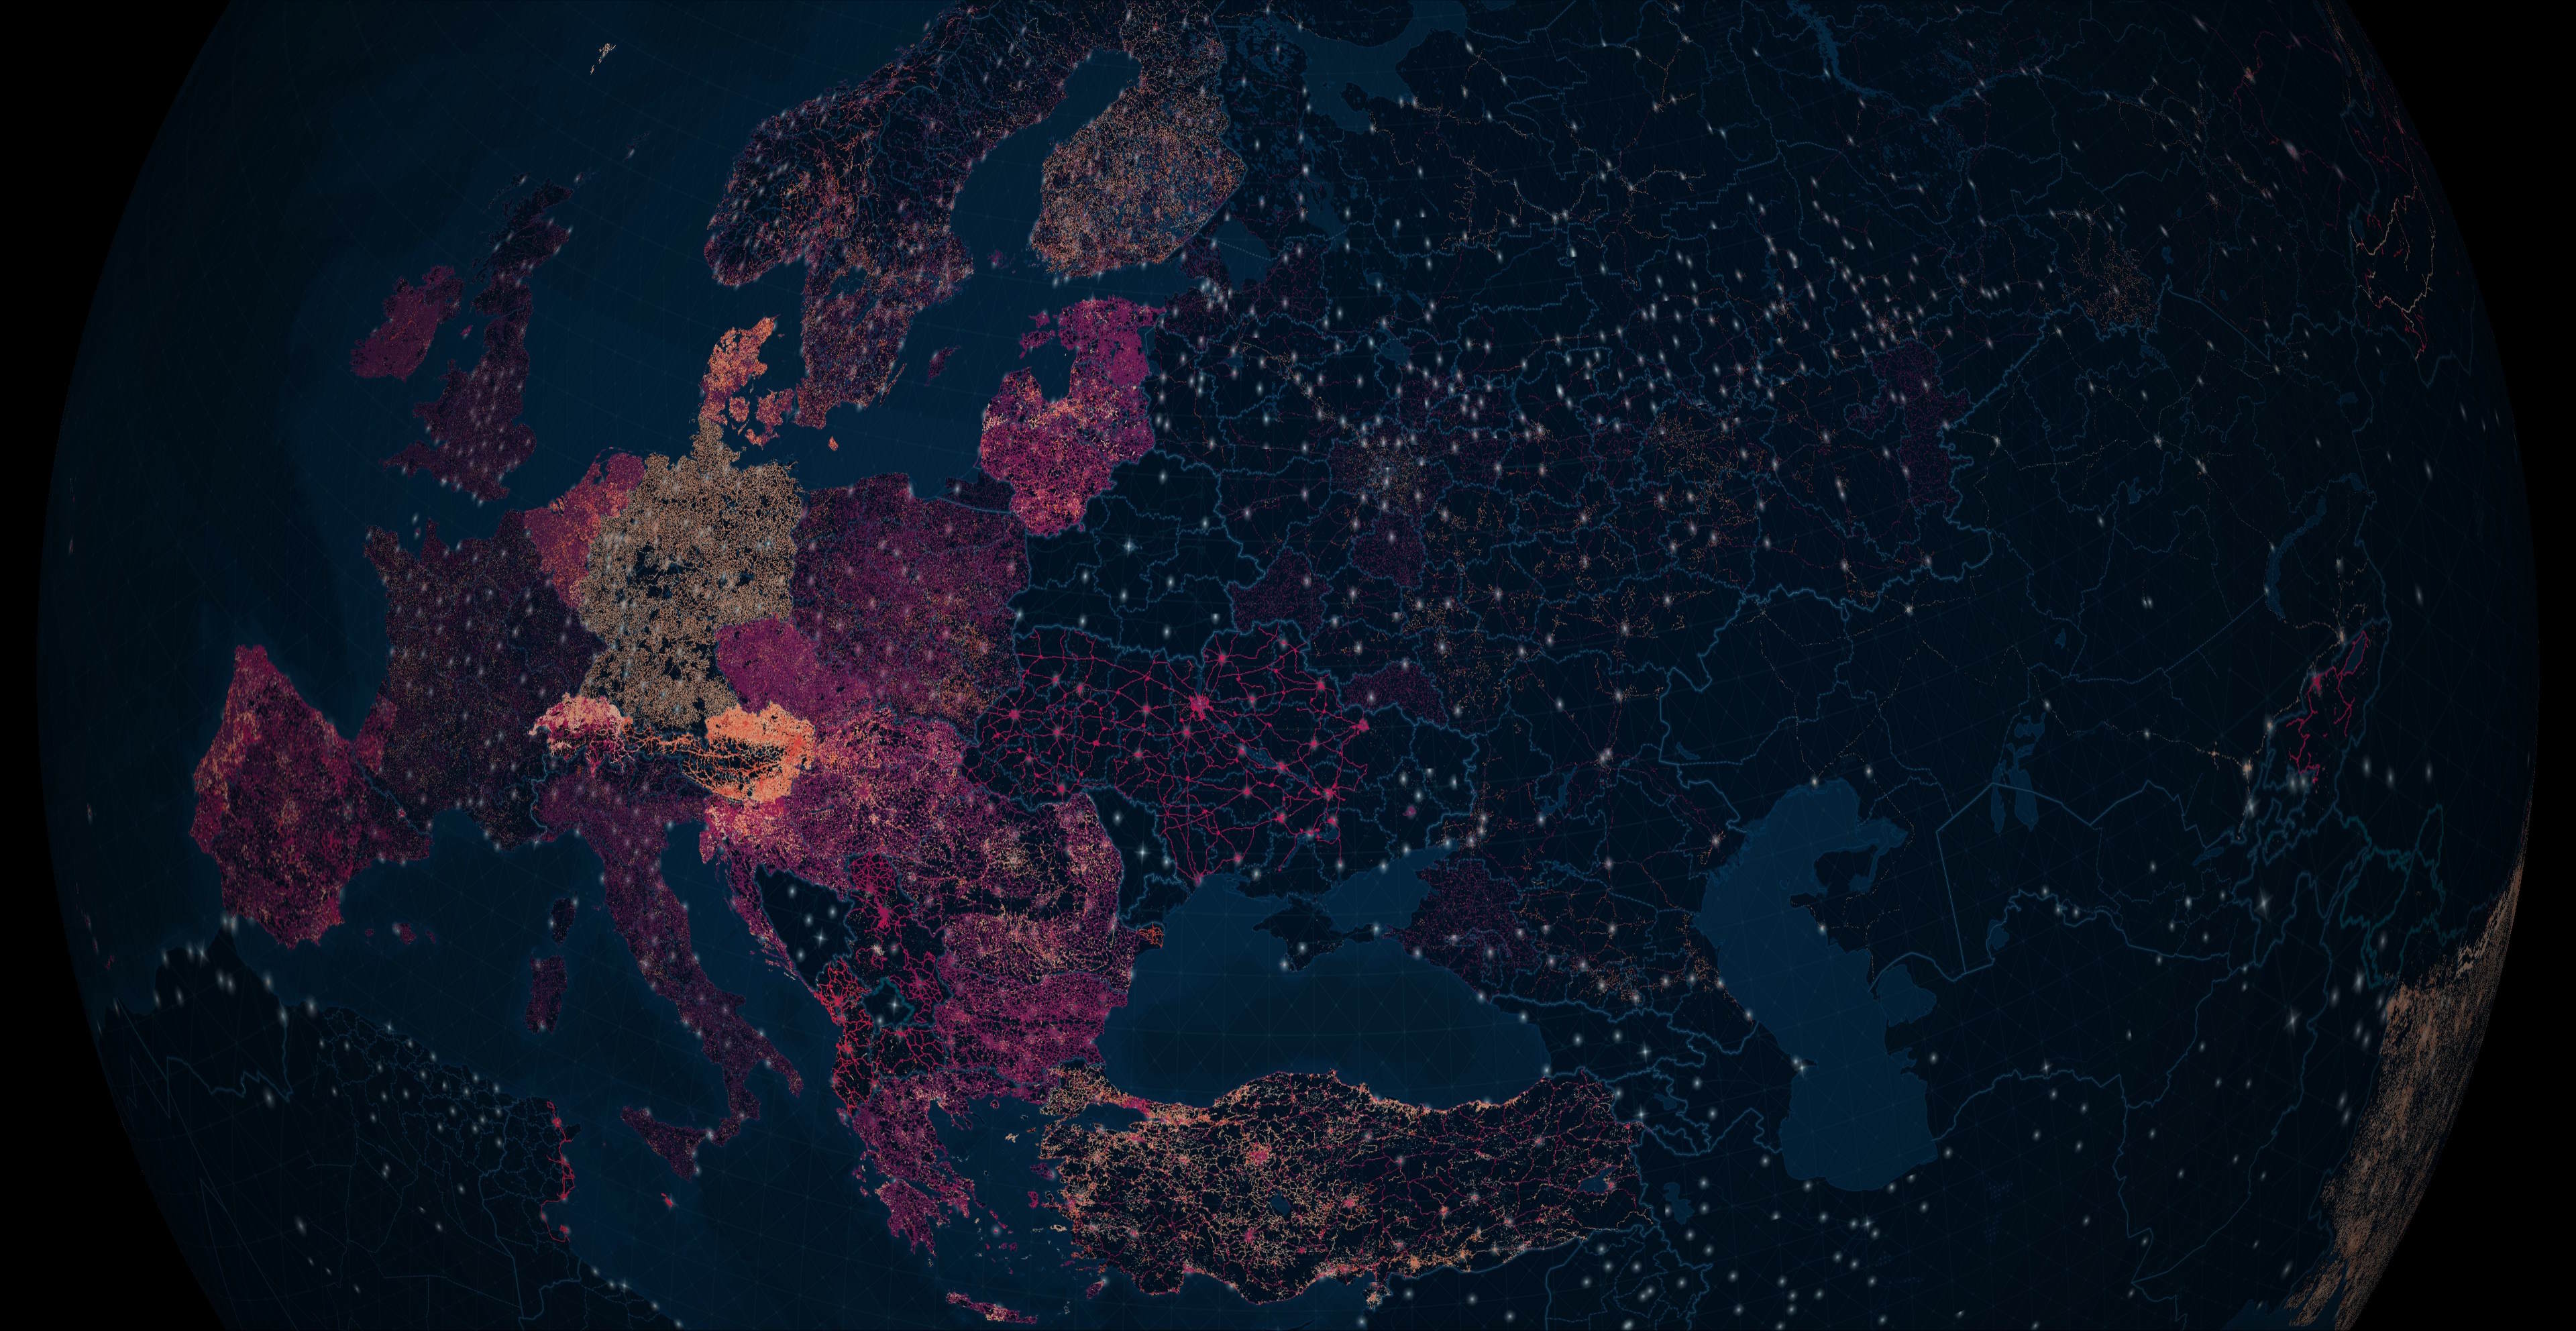
Below is the coverage across Europe. The darker colours are points that were updated closer to 2007 and the brighter colours closer to December of last year.
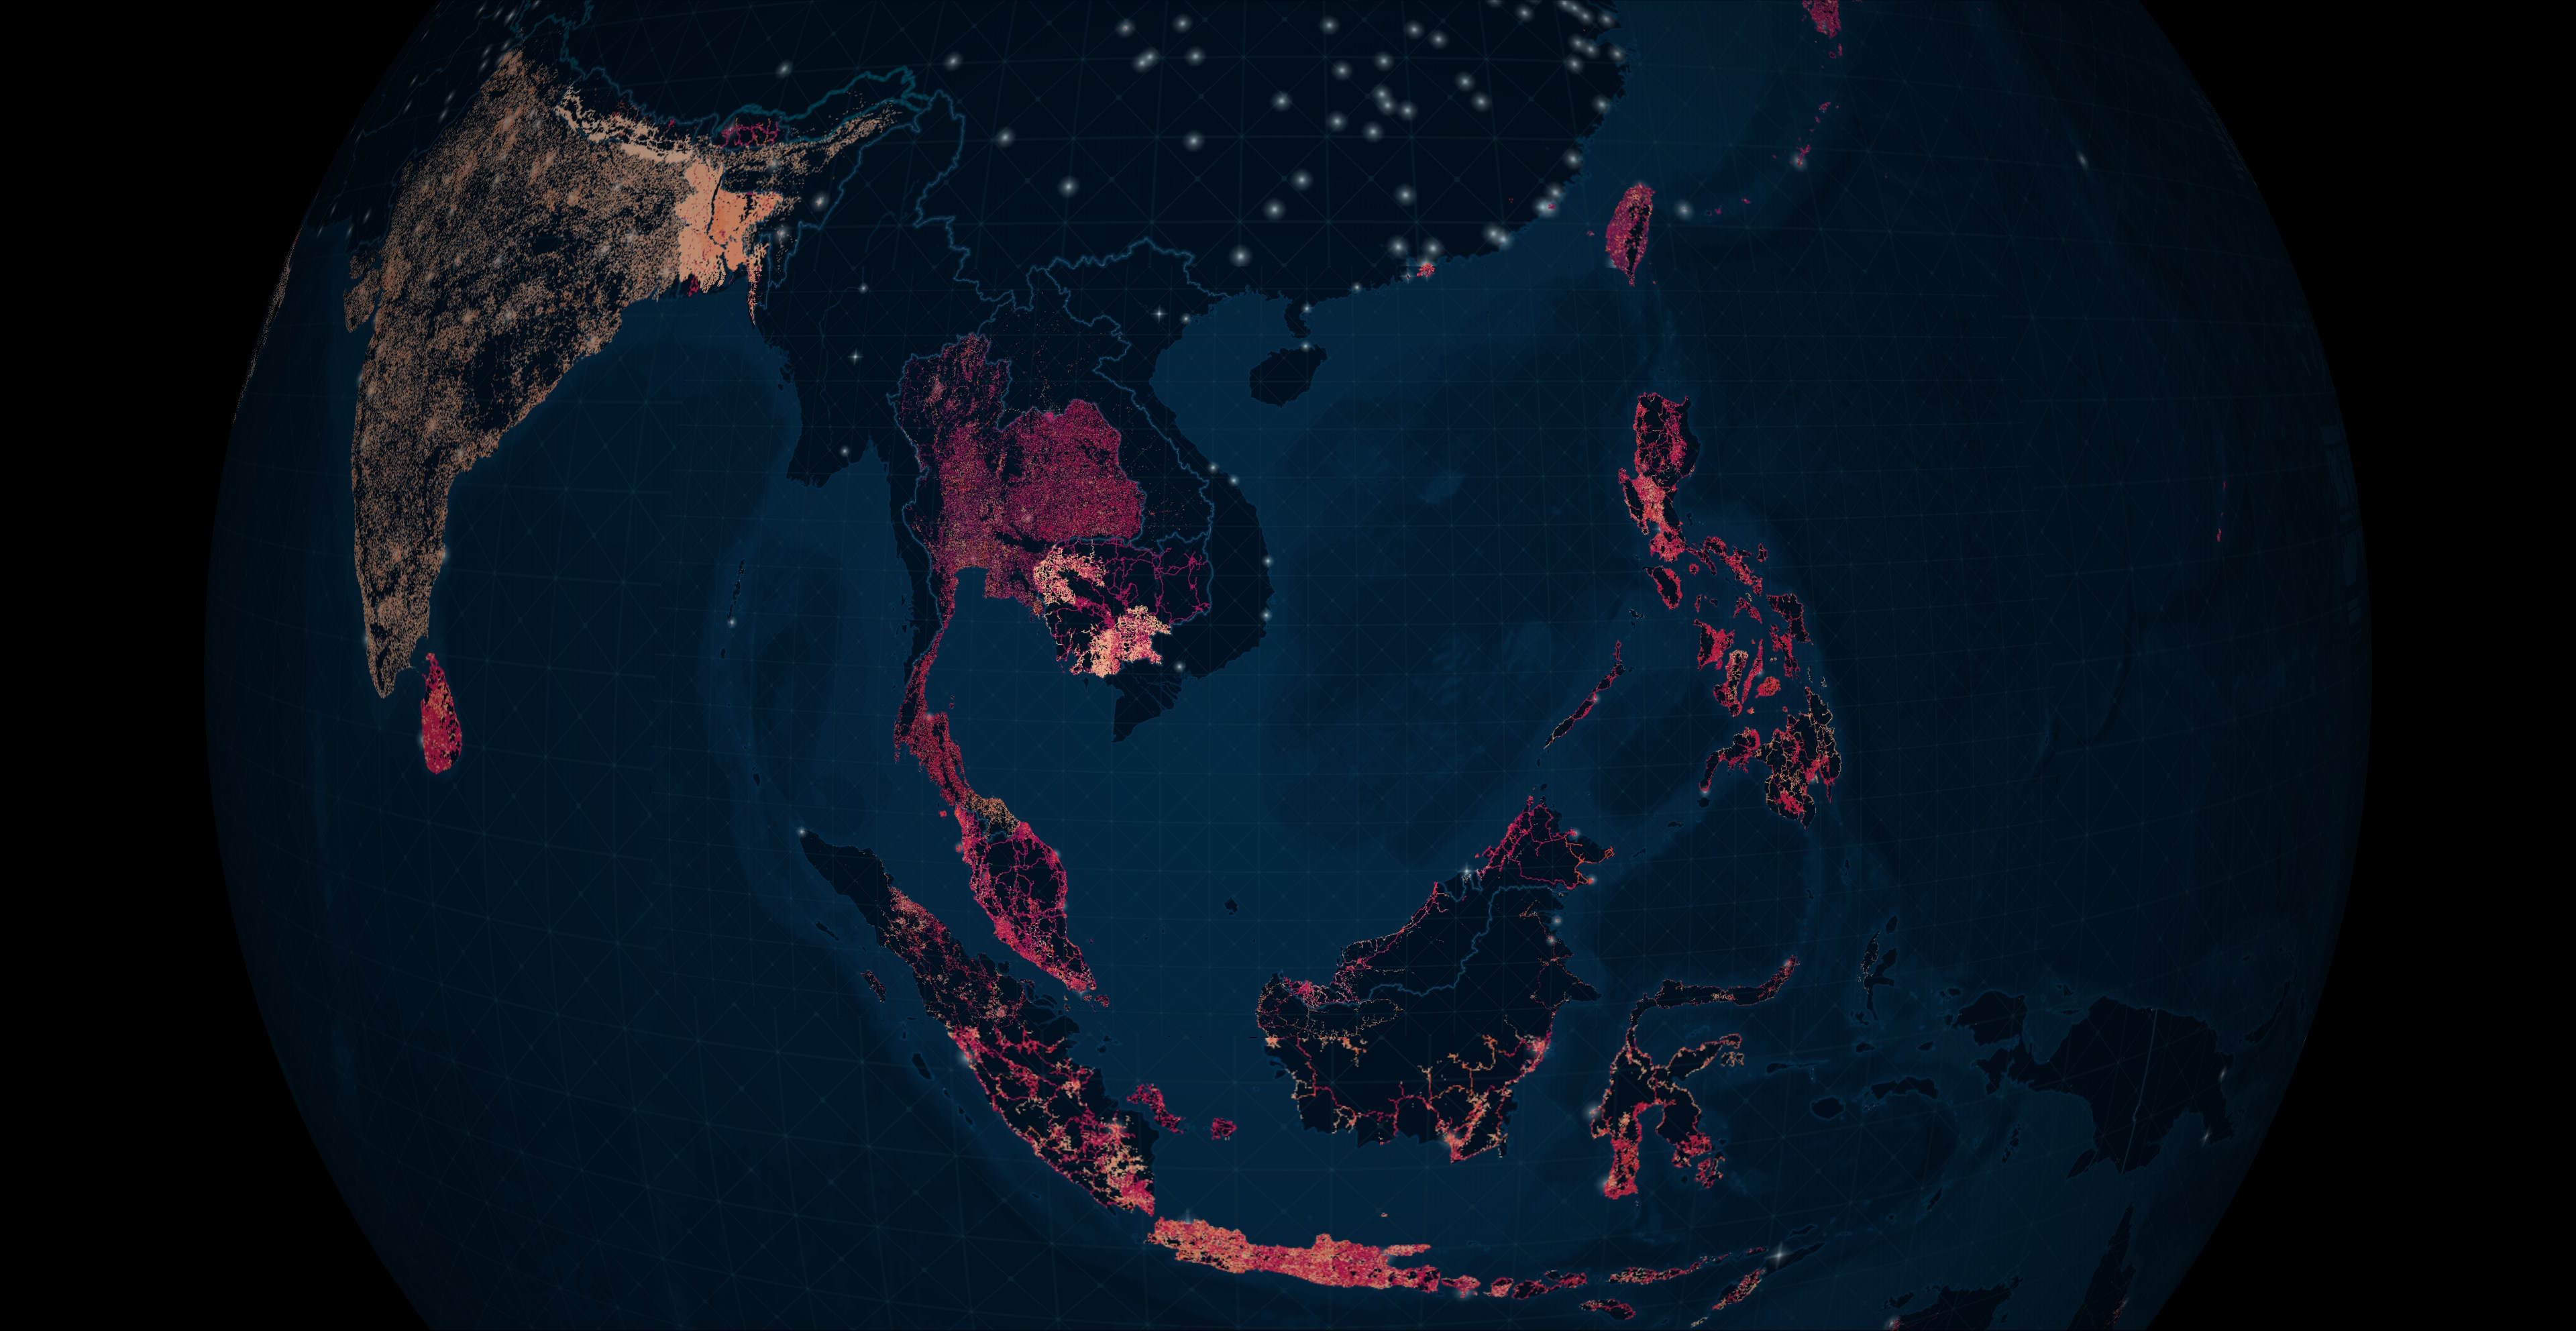
The following shows India and Southeast Asia's coverage.
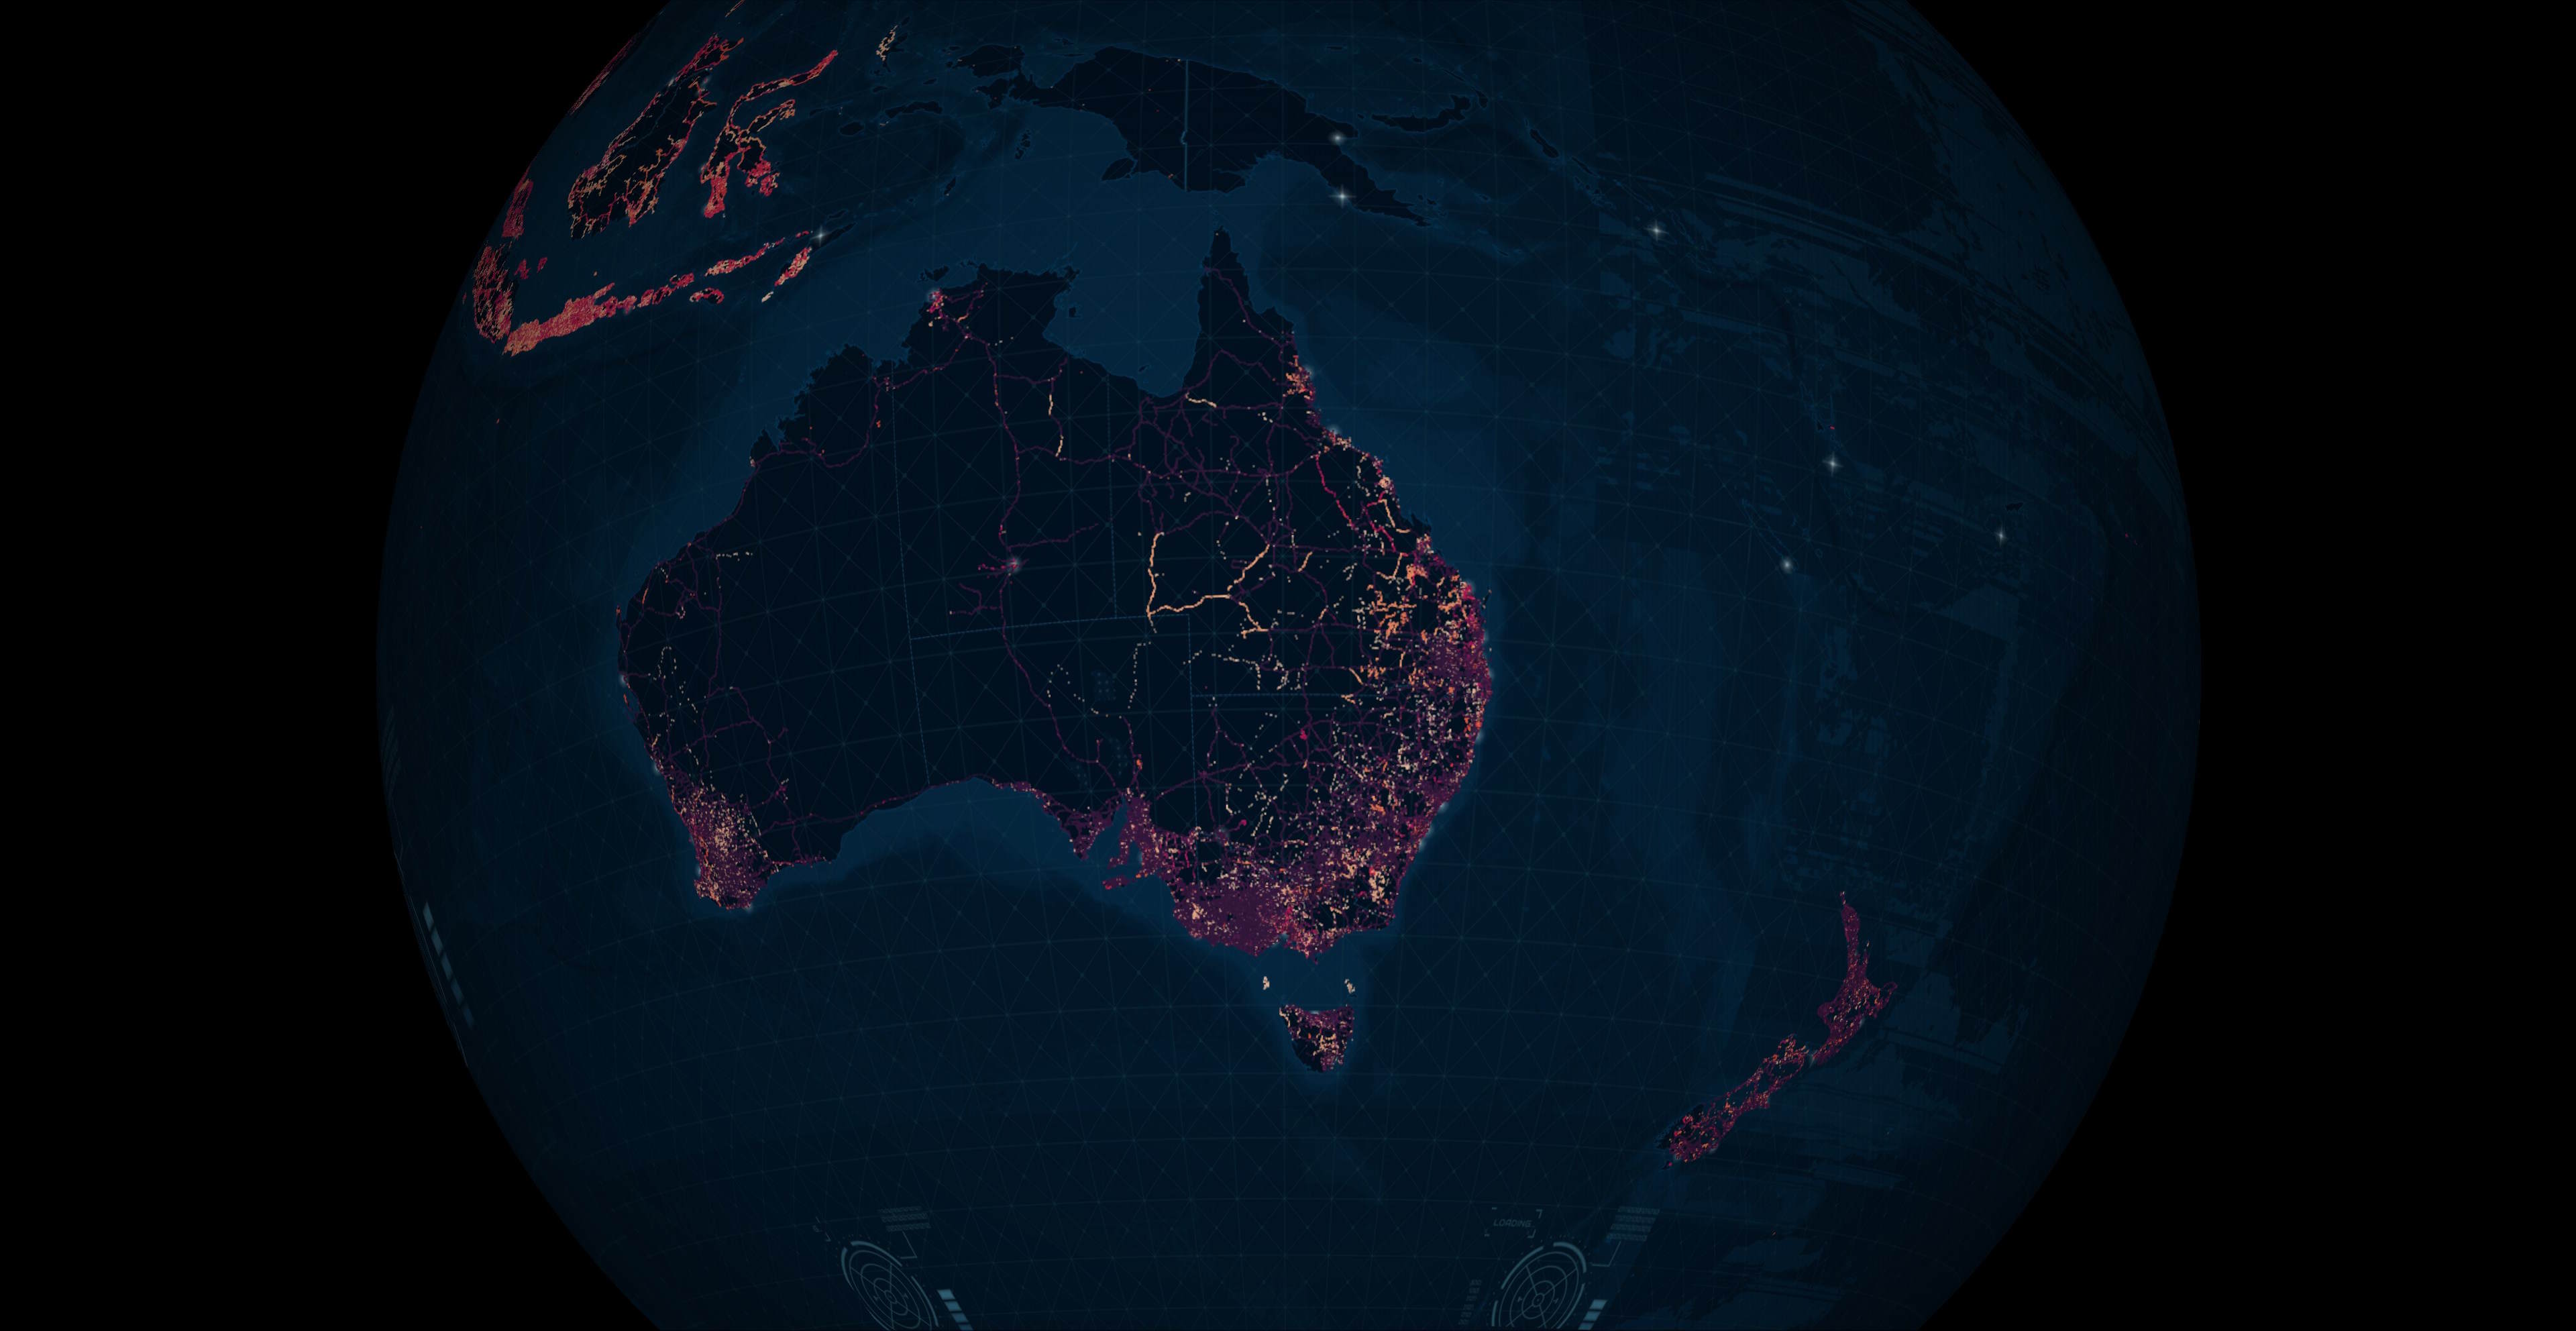
The following shows the coverage across Australia and New Zealand.
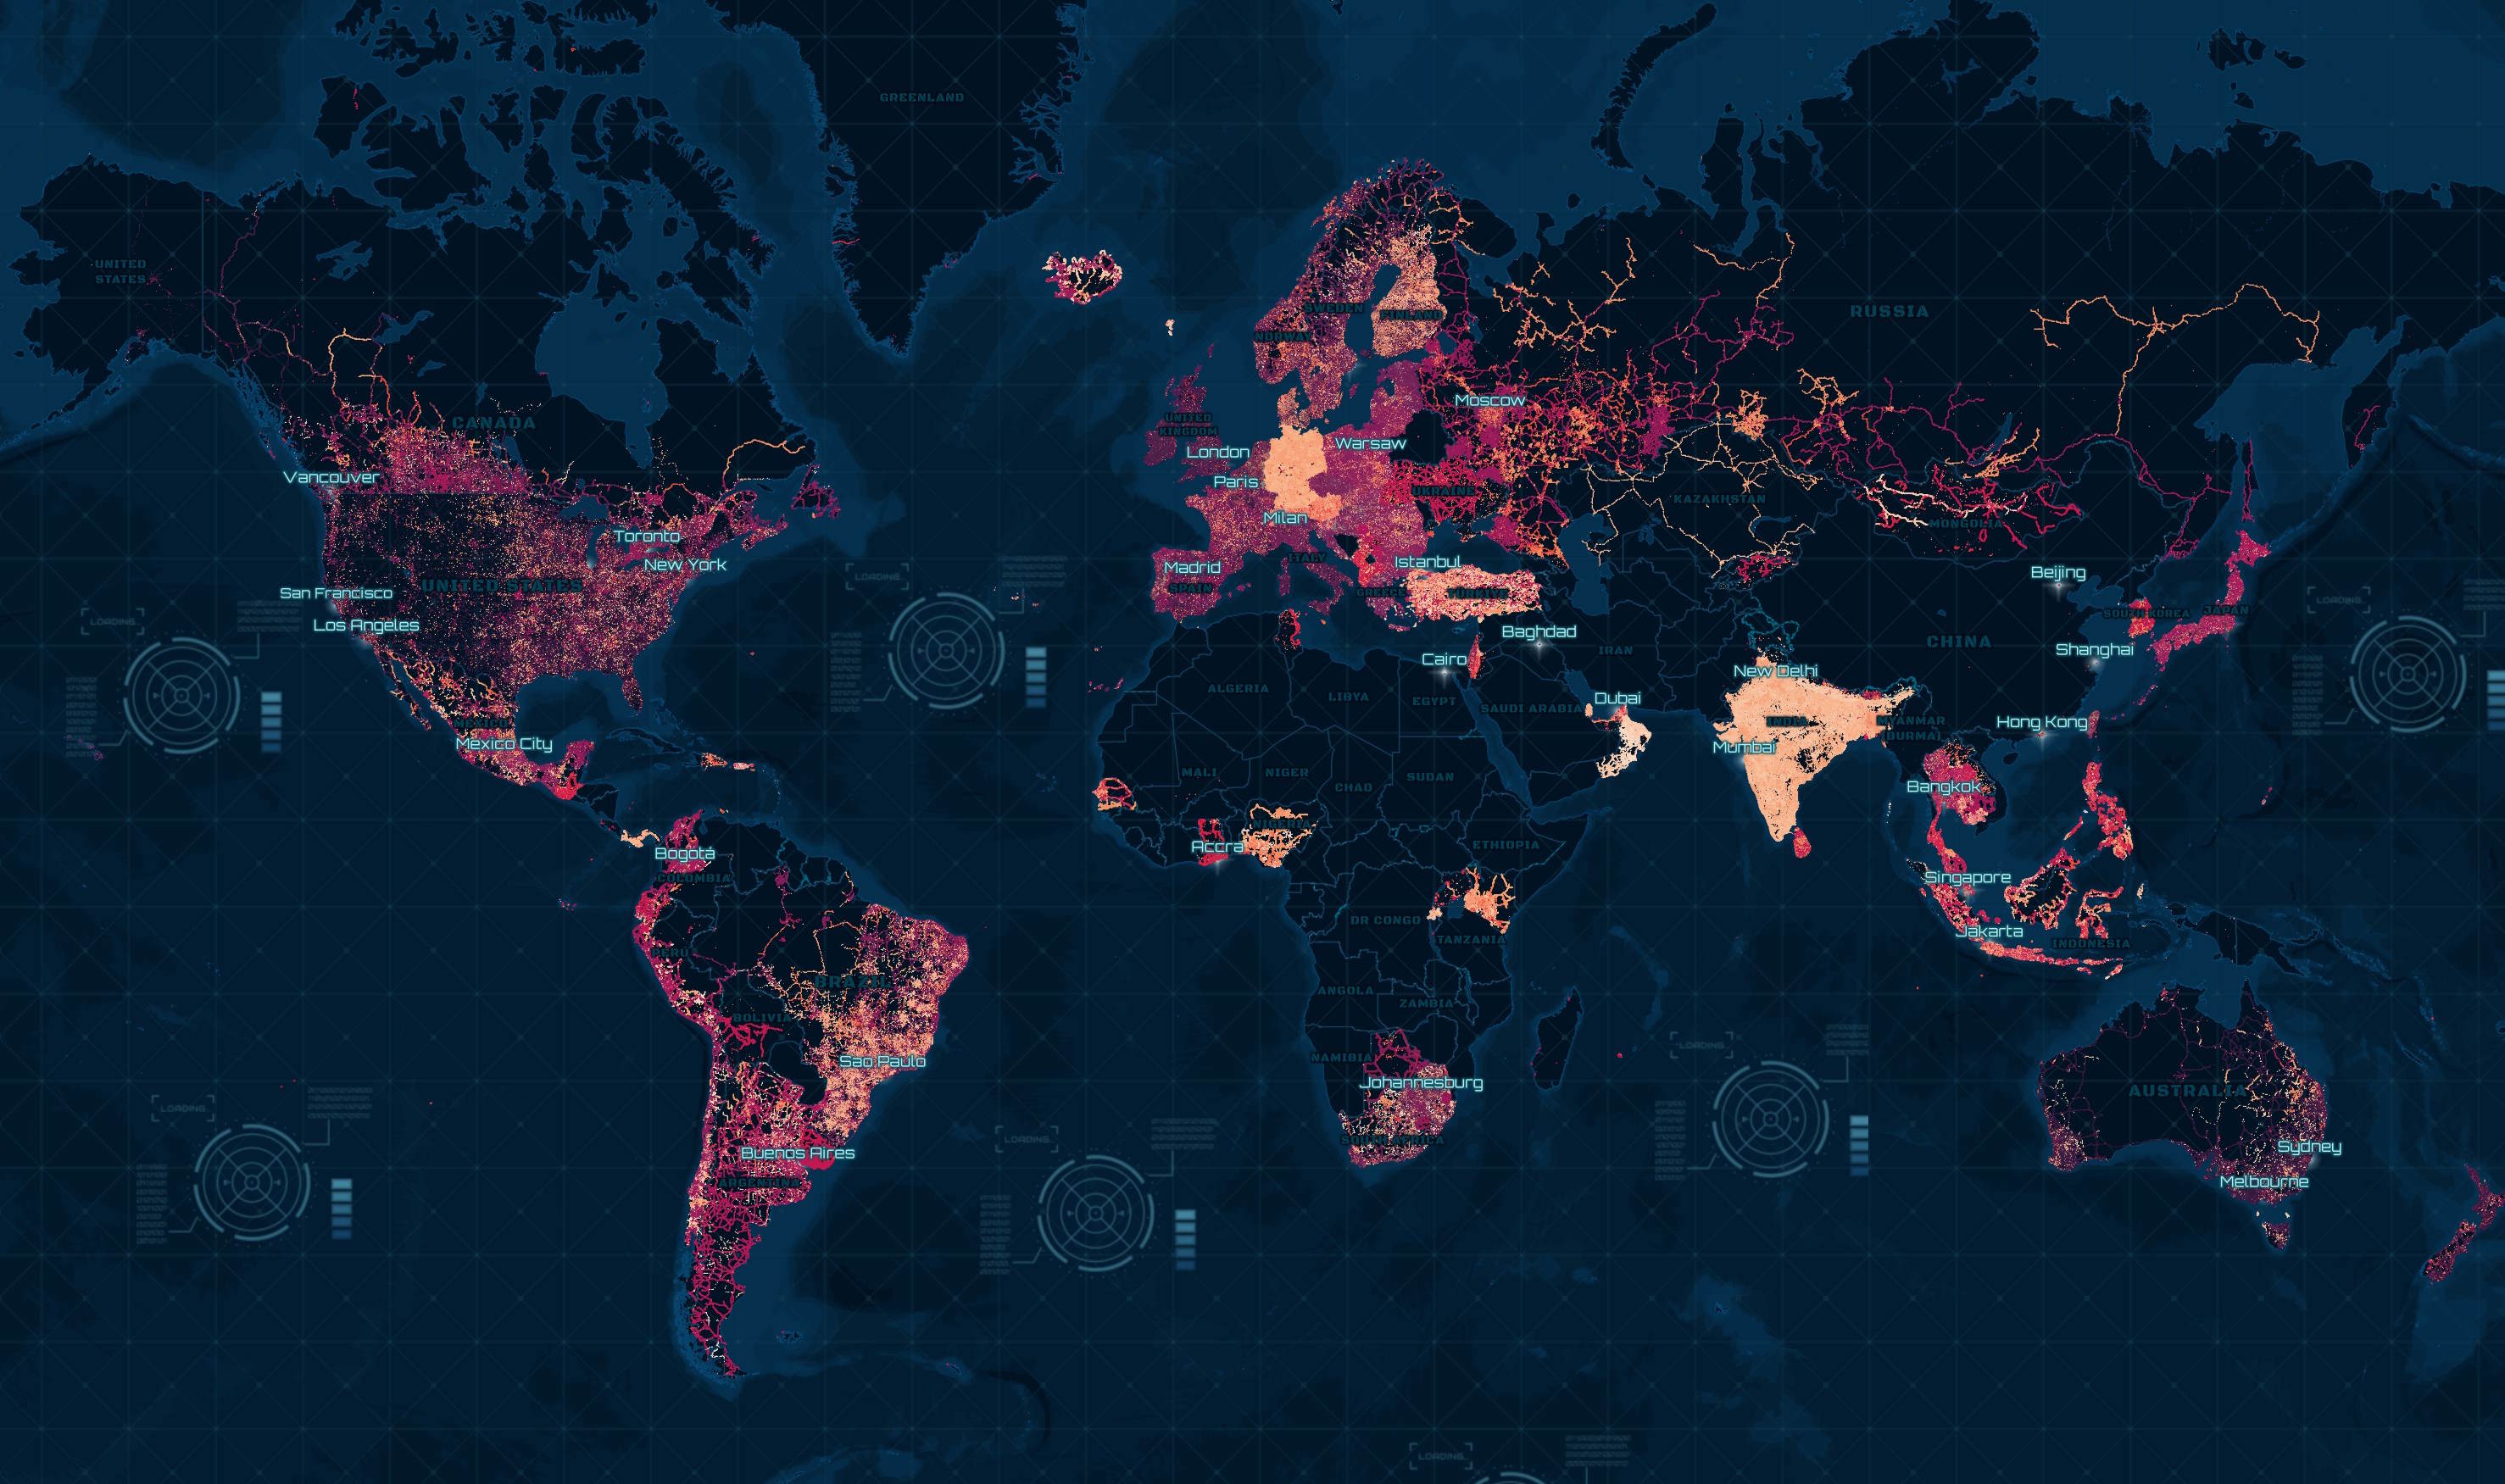
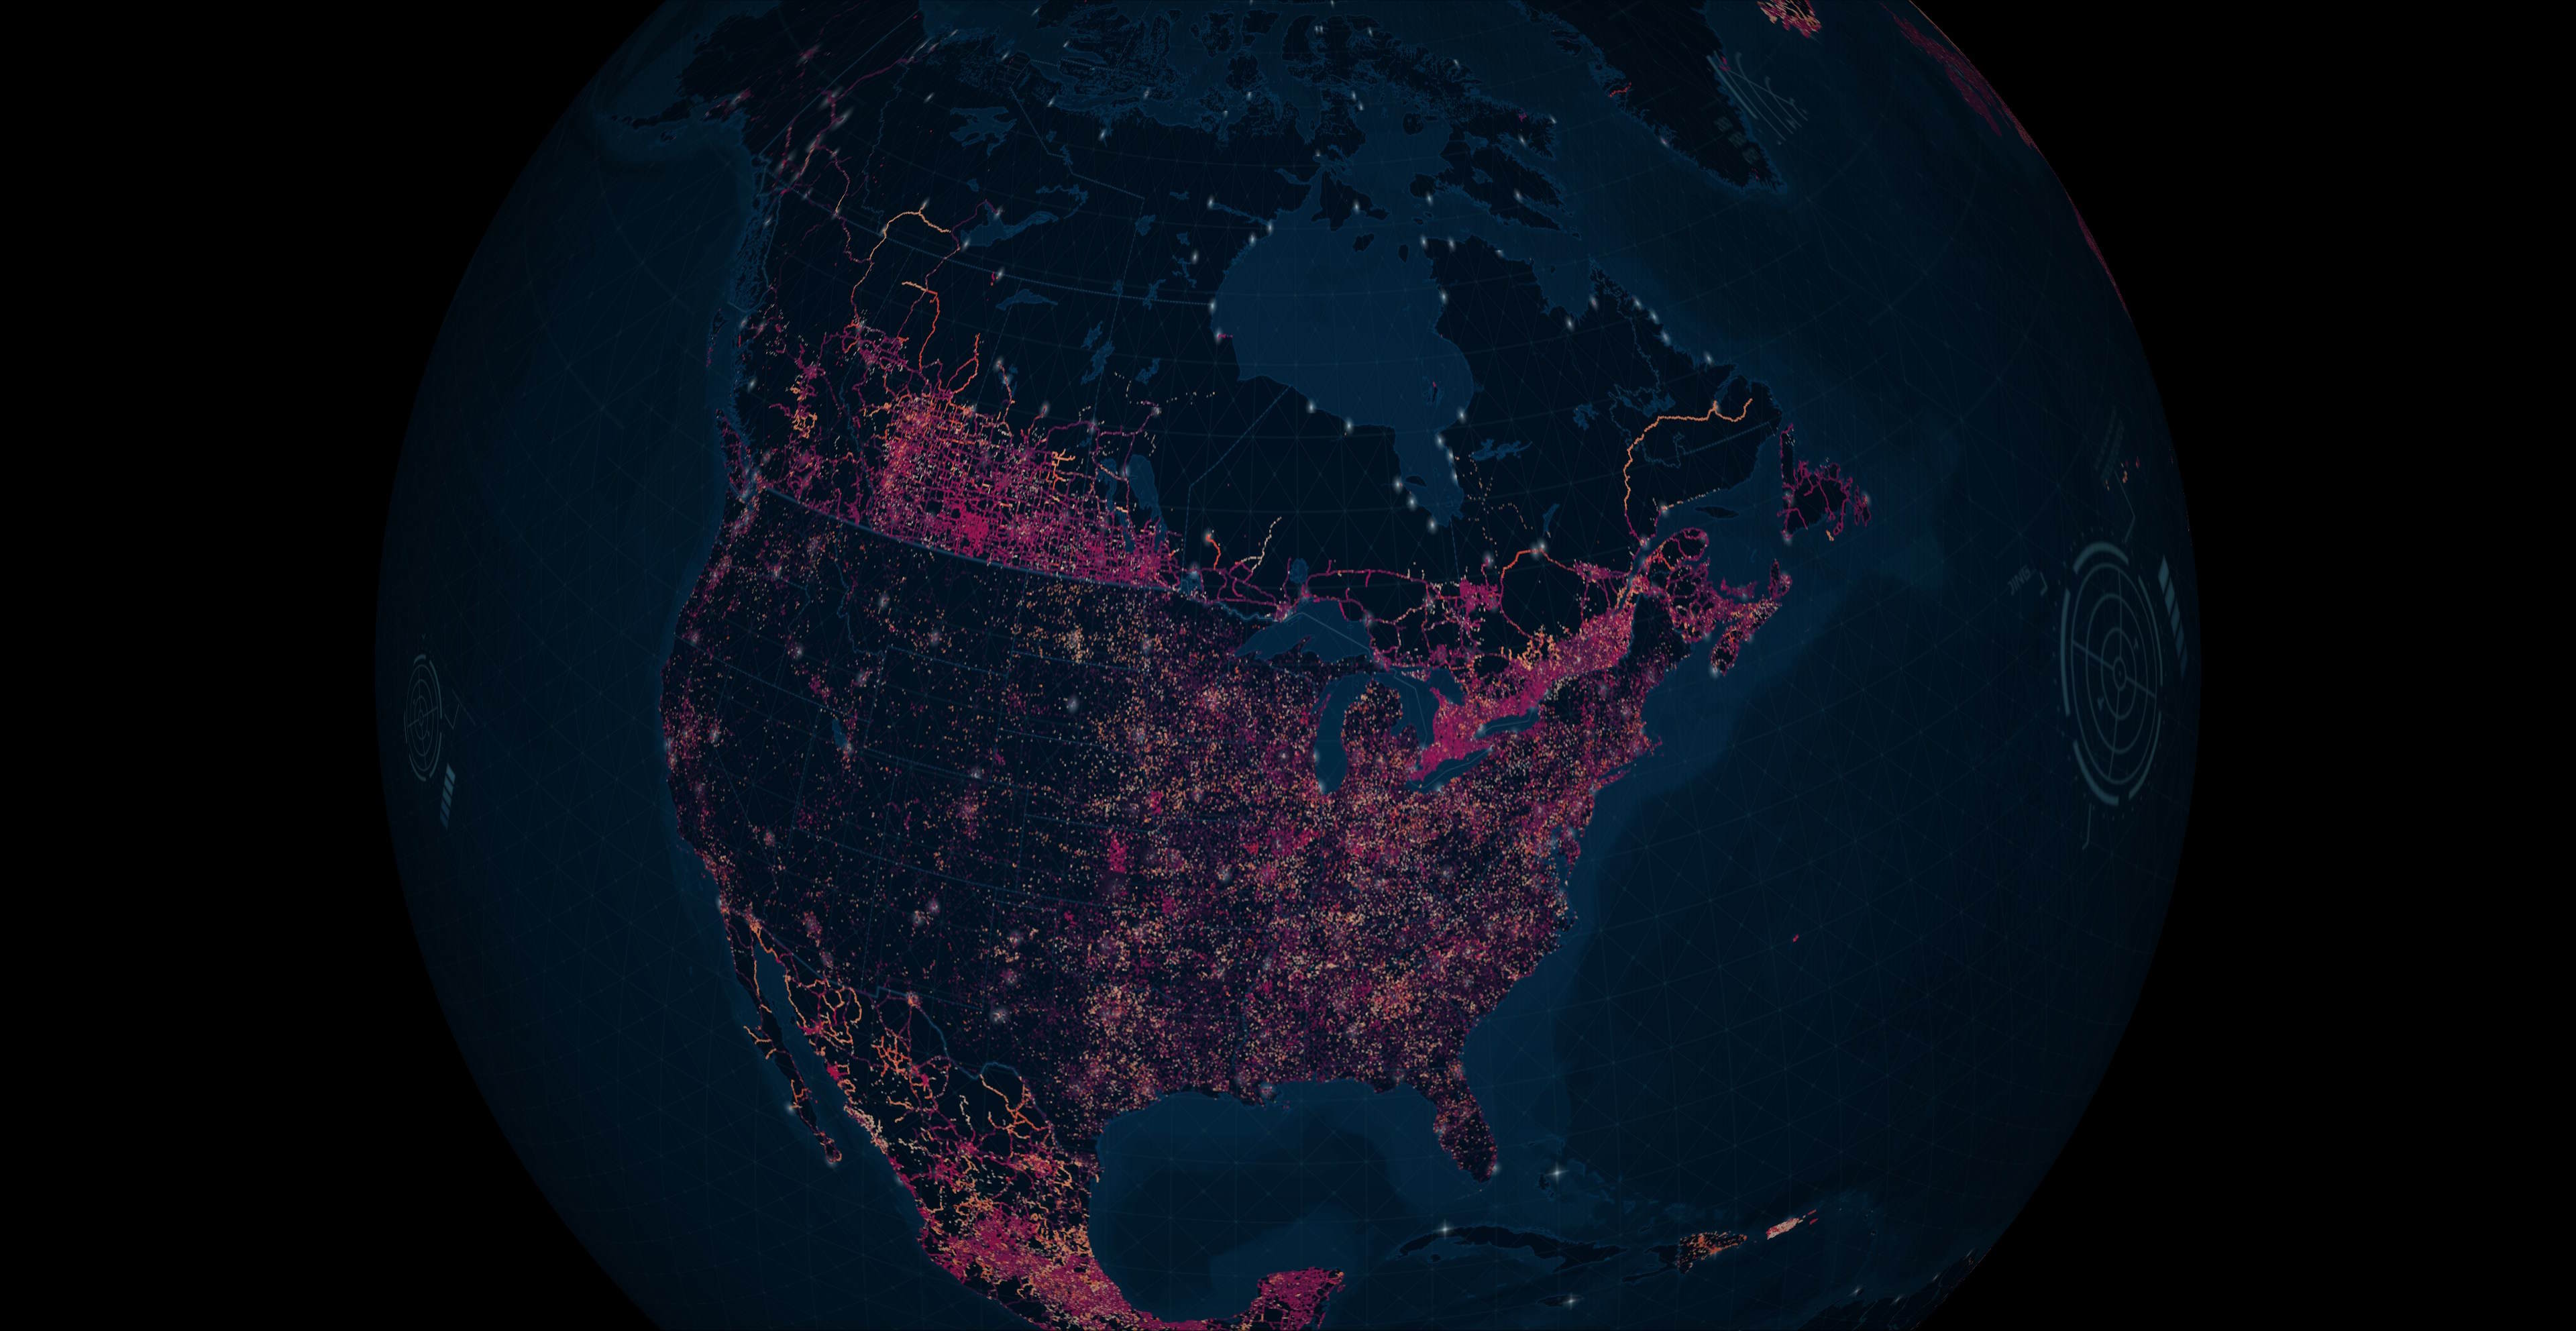
This is the coverage for North America.
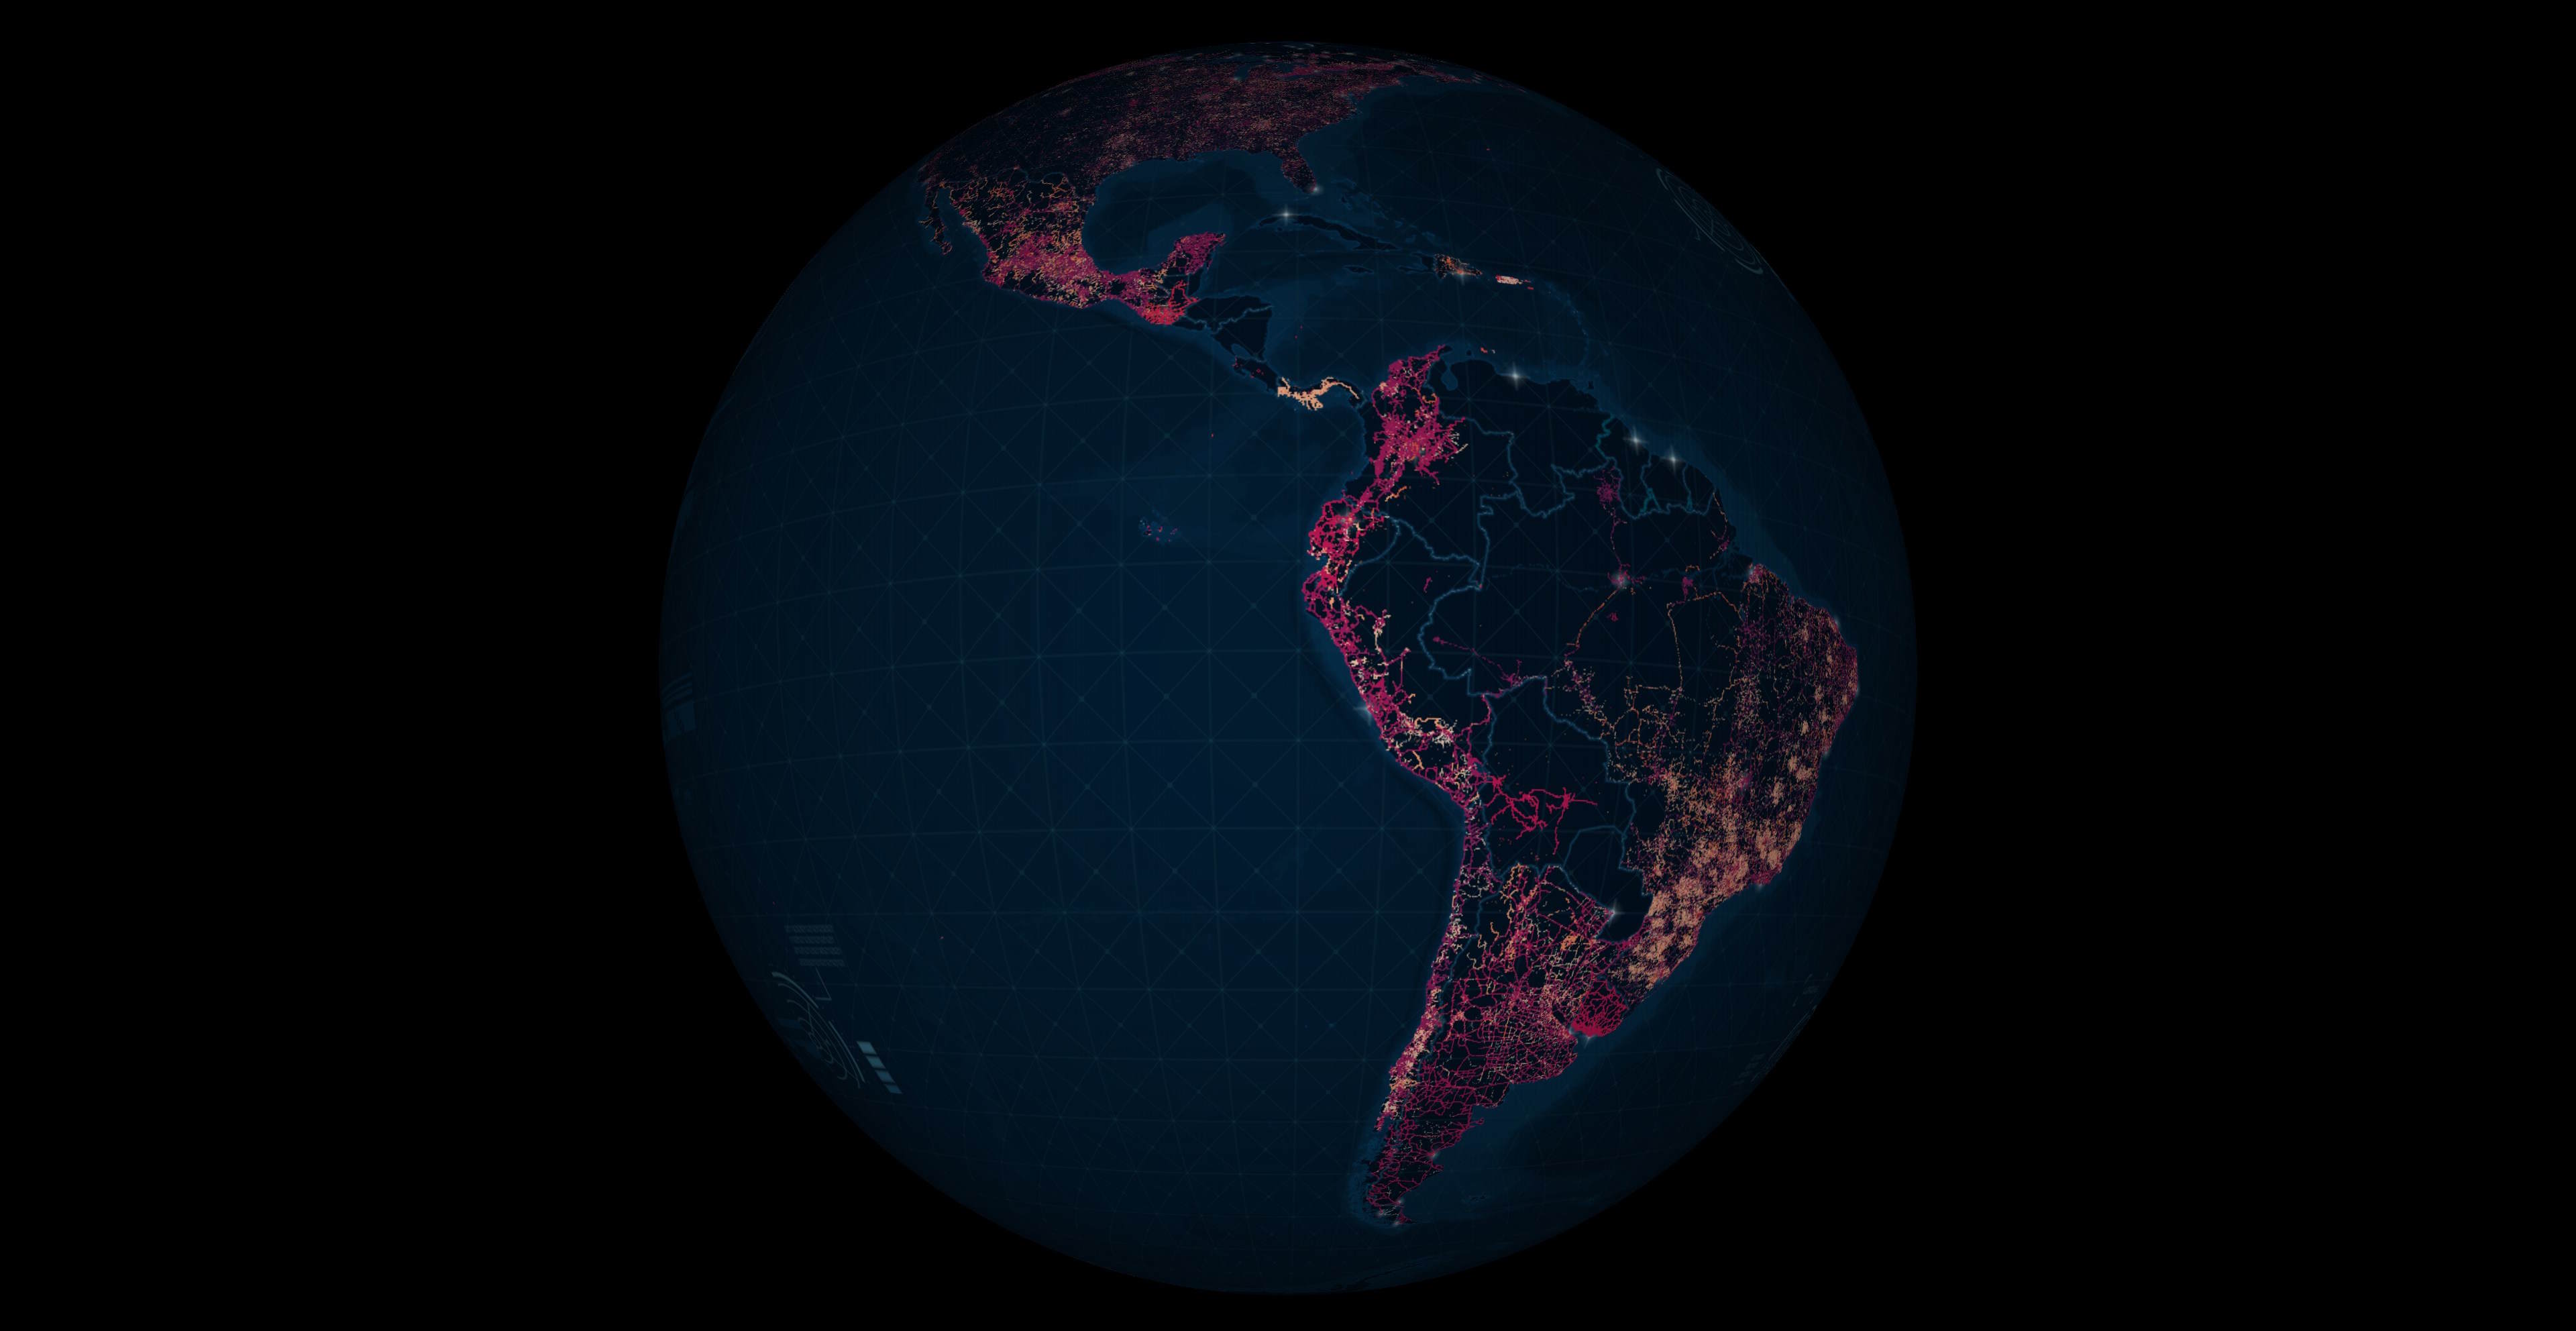
This is the coverage for Latin America and the Caribbean.
Thank you for taking the time to read this post. I offer both consulting and hands-on development services to clients in North America and Europe. If you'd like to discuss how my offerings can help your business please contact me via LinkedIn.