I believe this method works well because it turns a long context problem (hard for LLMs) into a coding and reasoning problem (much better!). You’re leveraging the last 18 months of coding RL by changing you scaffold.
So yes it works, we have customers in production.
Yes, it works really well.
1) The latest models are radically better at this. We noticed a massive improvement in quality starting with Sonnet 4.5
2) The context issue is real. We solve this by using sub agents that read through logs and return only relevant bits to the parent agent’s context
This post is a case study that shows one way to do this for a specific task. We found an RCA to a long-standing problem with our dev boxes this week using Ai. I fed Gemini Deep Research a few logs and our tech stack, it came back with an explanation of the underlying interactions, debugging commands, and the most likely fix. It was spot on, GDR is one of the best debugging tools for problems where you don't have full understanding.
If you are curious, and perhaps a PSA, the issue was that Docker and Tailscale were competing on IP table updates, and in rare circumstances (one dev, once every few weeks), Docker DNS would get borked. The fix is to ignore Docker managed interfaces in NetworkManager so Tailscale stops trying to do things with them.
Taking good note of your comment :)
Same is applicable for other language community, of course
I would like to see this approach compared to a more minimal approach with say, VictoriaLogs where the LLM is taught to use LogsQL, but overall it's a more "out of the box" architecture.
Basically a surefire way to train LLM to parse logs and detect real issues almost entirely depends on the readability and precision of logging. And if logging is good enough then humans can do debug faster and more reliable too :) . Unfortunately people reading logs and people coding them are almost not intersecting in practice and so the issue remains.
Lots of logs contain non-interesting information so it easily pollutes the context. Instead, my approach has a TF-IDF classifier + a BERT model on GPU for classifying log lines further to reduce the number of logs that should be then fed to a LLM model. The total size of the models is 50MB and the classifier is written in Rust so it allows achieve >1M lines/sec for classifying. And it finds interesting cases that can be missed by simple grepping
I trained it on ~90GB of logs and provide scripts to retrain the models (https://github.com/ascii766164696D/log-mcp/tree/main/scripts)
It's meant to be used with Claude Code CLI so it could use these tools instead of trying to read the log files
Large scale data like metrics, logs, traces are optimised for storage and access patterns and OLAP/SQL systems may not be the most optimal way to store or retrieve it. This is one of the reasons I’ve been working on a Text2SQL / Intent2SQL engine for Observability data to let an agent explore schema, semantics, syntax of any metrics, logs data. It is open sourced as Codd Text2SQL engine - https://github.com/sathish316/codd_query_engine/
It is far from done and currently works for Prometheus,Loki,Splunk for few scenarios and is open to OSS contributions. You can find it in action used by Claude Code to debug using Metrics and Logs queries:
Metric analyzer and Log analyzer skills for Claude code - https://github.com/sathish316/precogs_sre_oncall_skills/tree...
We're writing another post about that specifically, we'll publish it sometimes next week
We wrote about how this works for PostHog: https://www.mendral.com/blog/ci-at-scale
Meanwhile stats have fewer expectations, and moving signal out of the logs into stats is a much much smaller battle to win. It can’t tell you everything, but what it can tell you is easier to make unambiguous.
Over time I got people to stop pulling up Splunk as an automatic reflex and start pulling up Grafana instead for triage.
I agree with your statement and explained in a few other comments how we're doing this.
tldr:
- Something happens that needs investigating
- Main (Opus) agent makes focused plan and spawns sub agents (Haiku)
- They use ClickHouse queries to grab only relevant pieces of logs and return summaries/patterns
This is what you would do manually: you're not going to read through 10 TB of logs when something happens; you make a plan, open a few tabs and start doing narrow, focused searches.
- ZSTD (actual data compression)
- De-duplication (i.e. what you're saying)
Although AFAIK it's not "just point to it" but rather storing sorted data and being able to say "the next 2M rows have the same PR Title"
In this piece though--and maybe I need to read it again--I was under the impression that the LLM's "interface" to the logs data is queries against clickhouse. So long as the queries return sensibly limited results, and it doesn't go wild with the queries, that could address both concerns?
I don't think implementing filtering on log ingestion is the right approach, because you don't know what is noise at this stage. We spent more time on thinking about the schema and indexes to make sure complex queries perform at scale.
I took this a few steps further beyond the web UI's AI assistant. There's an MCP server[2] so any AI assistant (Claude Desktop, Cursor, etc.) can discover your log sources, introspect schemas, and query directly. And a Rust CLI[3] with syntax highlighting and `--output jsonl` for piping — which means you can write a skill[4] that teaches the agent to triage incidents by running `logchef query` and `logchef sql` in a structured investigation workflow (count → group → sample → pivot on trace_id).
The interesting bit is this ends up very similar to what OP describes — an agent that iteratively queries logs to narrow down root cause — except it's composable pieces you self-host rather than an integrated product.
[1] https://github.com/mr-karan/logchef
[2] https://github.com/mr-karan/logchef-mcp
[3] https://logchef.app/integration/cli/
[4] https://github.com/mr-karan/logchef/tree/main/.agents/skills...
(In that way you can see the title edit as conforming to the HN guideline: ""Please use the original title, unless it is misleading or linkbait; don't editorialize."" under the "linkbait" umbrella. - https://news.ycombinator.com/newsguidelines.html)
IIUC this is addressed with the ClickHouse JSON type which can promote individual fields in unstructured data into its own column: https://clickhouse.com/blog/a-new-powerful-json-data-type-fo...
Parquet is getting a VARIANT data type which can do the same thing (called "shredding") but in a standards-based way: https://parquet.apache.org/blog/2026/02/27/variant-type-in-a...
We noticed for example the importance of letting the model pull from the context, instead of pushing lots of data in the prompt. We have a "complex" error reporting because we have to differentiate between real non-retryable errors and errors that teach the model to retry differently. It changes the model behavior completely.
Also I agree with "significant weight of human input and judgement", we spent lots of time optimizing the index and thinking about how to organize data so queries perform at scale. Claude wasn't very helpful there.
Isn't that precisely what is done when prompting?
https://github.com/y-scope/clp
https://www.uber.com/blog/reducing-logging-cost-by-two-order...
This is an interesting approach. I definitely agree with the problem statement: if the LLM has to filter by error/fatal because of context window constraints, it will miss crucial information.
We took a different approach: we have a main agent (opus 4.6) dispatching "log research" jobs to sub agents (haiku 4.5 which is fast/cheap). The sub agent reads a whole bunch of logs and returns only the relevant parts to the parent agent.
This is exactly how coding agents (e.g. Claude Code) do it as well. Except instead of having sub agents use grep/read/tail, they use plain SQL.
Models are evolving fast. If your experience is older than a few months, I encourage you to try again.
I mean this with the best intentions: it's seriously mind boggling. We started doing this with Sonnet 4.0 and the relevance was okay at best. Then in September we shifted to Sonnet 4.5 and it's been night and day.
Every single model released since then (Opus 4.5, 4.6) has meaningfully improved the quality of results
Any qualifiers here from your experience or documentation?
In the history of this company, I can honestly say that this SQL/LLM thing wasn't the hardest :)
Last week, our agent traced a flaky test to a dependency bump three weeks prior. It did this by writing its own SQL queries, scanning hundreds of millions of log lines across a dozen queries, and following a trail from job metadata to raw log output. The whole investigation took seconds.
To do this, the agent needs context: not one log file, but every build, every test, every log line, across months of history. Every week, about 1.5 billion CI log lines and 700K jobs flow through our system. All of it lands in ClickHouse, compressed at 35:1. All of it is queryable in milliseconds.
We expose a SQL interface to the agent, scoped to the organization it's investigating. The agent constructs its own queries based on the question. No predefined query library, no rigid tool API.
LLMs are good at SQL. There's an enormous amount of SQL in training data, and the syntax maps well to natural-language questions about data. A constrained tool API like get_failure_rate(workflow, days) would limit the agent to the questions we anticipated. A SQL interface lets it ask questions we never thought of, which matters when you're debugging novel failures.
The agent queries two main targets:
Job metadata: a materialized view with one row per CI job execution. The agent uses this 63% of the time for questions like "how often does this fail?", "what's the success rate?", "which jobs are slowest?", "when did this start failing?"
Raw log lines: one row per log line. The agent uses this 37% of the time for questions like "show me the error output for this job", "when did this log pattern first appear?", "how often does this error message occur across runs?"
We analyzed 8,534 agent sessions and 52,312 queries from our observability pipeline.
The agent doesn't stop at one query. It investigates. Starts broad, then drills in. Total rows scanned across all queries to answer one question:
| Target | Sessions | Avg queries | Median rows | P75 | P95 |
|---|---|---|---|---|---|
| Job metadata | 8,210 | 4.0 | 164K | 563K | 4.4M |
| Raw log lines | 5,413 | 3.5 | 4.4M | 69M | 4.3B |
| Combined | 8,534 | 4.4 | 335K | 5.2M | 940M |
The typical question scans 335K rows across about 3 queries. At P75 it's 5.2 million rows. At P95 it's 940 million rows. The heaviest raw-log sessions, deep investigations tracing error patterns across months of history, scan 4.3 billion rows.
The agent starts broad and narrows. A typical investigation begins with job metadata: "what's the failure rate for this workflow?", "which jobs failed on this commit?" These are cheap queries (median 47K rows) against a compact, pre-aggregated materialized view.
When it finds something interesting, it drills into raw logs: "show me the stack trace for this specific failure", "has this error message appeared before?" These are the expensive queries (median 1.1M rows), full-text scans across log output. But this is exactly the kind of search that would take a human minutes of scrolling through GitHub Actions log viewers.
The agent averages 4.4 queries per session, but heavy investigations issue many more. A P95 session isn't one big query. It's the agent following a trail, query after query, as it narrows in on a root cause.
For the agent to query this fast, the data needs to be structured for it. Up to 300 million log lines flow through on a busy day. We use ClickHouse.
Every log line in our system carries 48 columns of metadata: the full context of the CI run it belongs to. Commit SHA, author, branch, PR title, workflow name, job name, step name, runner info, timestamps, and more.
In a traditional row-store, this would be insane. You'd normalize. Run-level metadata in one table, job metadata in another, join at query time. Denormalizing 48 columns onto every single log line sounds like a storage disaster.
In ClickHouse's columnar format, it's essentially free.
A column like commit_message has the same value for every log line in a CI run, and a single run can produce thousands of log lines. ClickHouse stores those thousands of identical values in sequence. The compression algorithm sees the repetition and compresses it to almost nothing.
| Column | Compression ratio | Why |
|---|---|---|
commit_message |
301:1 | Same message for every line in a run (thousands of lines) |
display_title |
160:1 | Same PR/commit title across all lines |
workflow_path |
79:1 | Same .github/workflows/foo.yml path |
step_name |
52:1 | Same step name across hundreds of lines |
job_name |
48:1 | Same job name across hundreds/thousands of lines |
The agent asks arbitrary questions. One might filter by commit author, the next by runner label, the next by step name. Without denormalization, every one of those requires a join. With it, they're all column predicates.
| Layer | Size |
|---|---|
Raw log text (line_content uncompressed) |
664 GiB |
| All 48 columns uncompressed | 5.31 TiB |
| On disk (compressed) | 154 GiB |
| Compression ratio | 35:1 |
The raw log text alone is 664 GiB. Adding all 48 columns of metadata inflates it to 5.31 TiB uncompressed, 8x the raw text. On disk, the whole thing compresses to 154 GiB. ClickHouse stores 8x more data (all the enriched metadata) in a quarter of the size of the raw text alone.
That's about 21 bytes per log line on disk, including all 48 columns. Yes, really. 21 bytes for a log line plus its commit SHA, author, branch, job name, step name, runner info, and 41 other fields.
Not all columns compress equally. The unique-per-row columns (log text, timestamp, line number) compress modestly and dominate storage. The metadata columns, which repeat across thousands of lines, are nearly free.
| Column | On disk | % of total | Compression ratio |
|---|---|---|---|
line_content (log text) |
53.2 GiB | 34.7% | 12.5:1 |
ts (nanosecond timestamp) |
15.7 GiB | 10.2% | 3.7:1 |
line_number |
12.4 GiB | 8.1% | 2.3:1 |
job_name |
8.2 GiB | 5.4% | 48:1 |
runner_name |
4.5 GiB | 2.9% | 31:1 |
job_id |
3.9 GiB | 2.5% | 15:1 |
runner_labels |
3.8 GiB | 2.5% | 52:1 |
| Everything else (41 columns) | ~51 GiB | ~33% | varies |
The top three (line_content, ts, line_number) account for 53% of all storage. Everything else is repeated metadata that compresses to almost nothing.
We use a few ClickHouse patterns that keep things fast:
Primary key design means the data is physically sorted for our access pattern. The sort order is (org, ts, repository, run_id, ...), so every query is scoped to one organization and a time range, and ClickHouse skips everything else without reading it.
Skip indexes let ClickHouse avoid scanning data it doesn't need. We use bloom filters on 14 columns (org, repository, job name, branch, commit SHA, etc.) and an ngram bloom filter on line_content for full-text search. When the agent searches for an error message across billions of log lines, ClickHouse checks the ngram index to skip granules that can't contain the search term, turning a full table scan into a targeted read.
Materialized views pre-compute aggregations on insert. When the agent asks "what's the failure rate for this workflow over the last 30 days?", the answer is already computed. The aggregation happened when the data was written.
Async inserts give us high write throughput without building our own batching layer. We fire-and-forget individual inserts, and ClickHouse batches them internally.
Query latency across 52K queries:
| Target | Queries | Median | P75 | P95 |
|---|---|---|---|---|
| Job metadata | 33K | 20ms | 30ms | 80ms |
| Raw log lines | 19K | 110ms | 780ms | 18.1s |
Job metadata queries return in 20ms at the median. Raw log queries, scanning a million rows at the median, come back in 110ms.
Latency scales roughly linearly with rows scanned:
| Rows scanned | Queries | Median latency | P95 latency |
|---|---|---|---|
| < 1K | 1,621 | 10ms | 50ms |
| 1K-10K | 2,608 | 20ms | 50ms |
| 10K-100K | 27,044 | 20ms | 50ms |
| 100K-1M | 8,515 | 40ms | 390ms |
| 1M-10M | 7,199 | 90ms | 1.2s |
| 10M-100M | 2,630 | 690ms | 6.8s |
| 100M-1B | 1,814 | 6.8s | 30.6s |
| 1B+ | 1,029 | 31s | 82s |
10x more rows ≈ 10x more latency. 60% of all queries scan under 100K rows and return in under 50ms, fast enough that the agent can fire off several per second without breaking stride. At the extreme end, the agent occasionally scans over a billion rows in a single query; even those complete in about 30 seconds at the median.
None of the above works without fresh data. The agent needs to reason about the build that just failed, not one from an hour ago.
GitHub's API gives you 15,000 requests per hour per App installation (5,000 on non-Enterprise plans). That sounds generous until you're continuously polling workflow runs, jobs, steps, and log output across dozens of active repositories. A single commit can spawn hundreds of parallel jobs, each producing logs you need to fetch.
And ingestion isn't the only thing hitting the API. When the agent investigates a failure, it pulls PR metadata, reads file diffs, posts comments, and opens pull requests. All of that counts against the same 15,000-request budget. Throttle ingestion too aggressively and your data goes stale. Throttle too little and you starve the agent of the API access it needs to do its job.
Early on, we hit this. Our ingestion would slam into the rate limit, get blocked for the remainder of the hour, and fall behind. By the time it caught up, we were ingesting logs from 30+ minutes ago. For an agent that needs to reason about the build that just failed, that's useless. If an engineer has to wait for the agent to catch up, they've already context-switched to investigating manually.
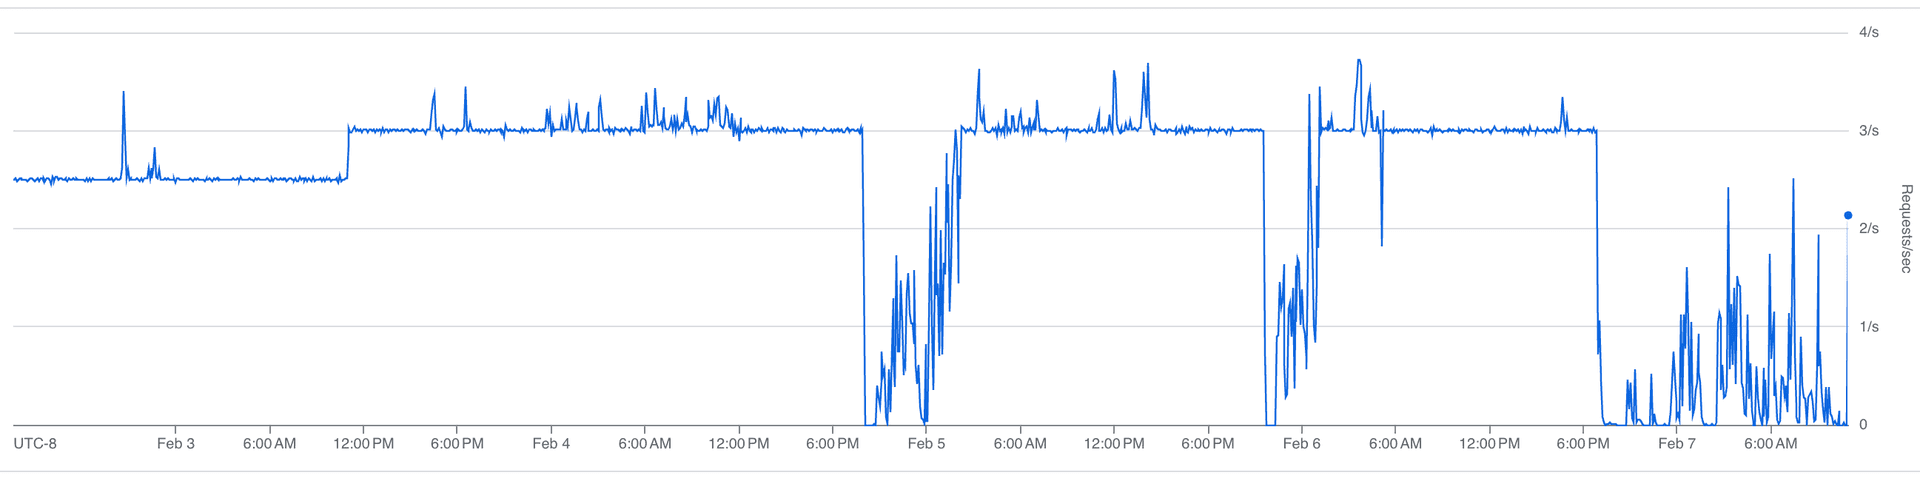
The fix was throttling: spreading requests evenly across the rate limit window instead of bursting. We cap ingestion at roughly 3 requests per second, keeping about 4,000 requests per hour free for the agent.
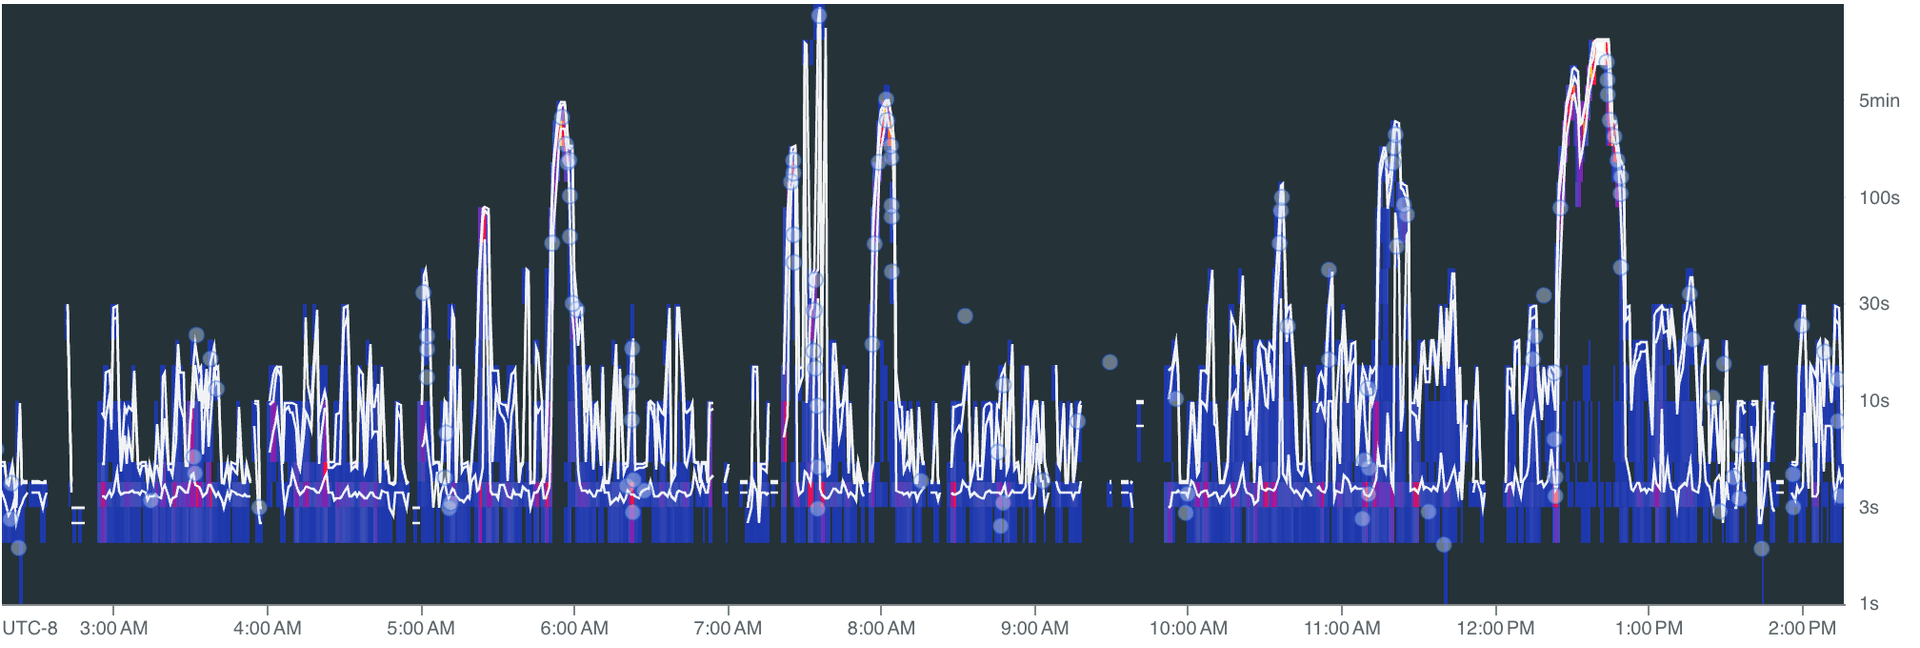
Our sustained request rate:

Our rate limit budget over time:

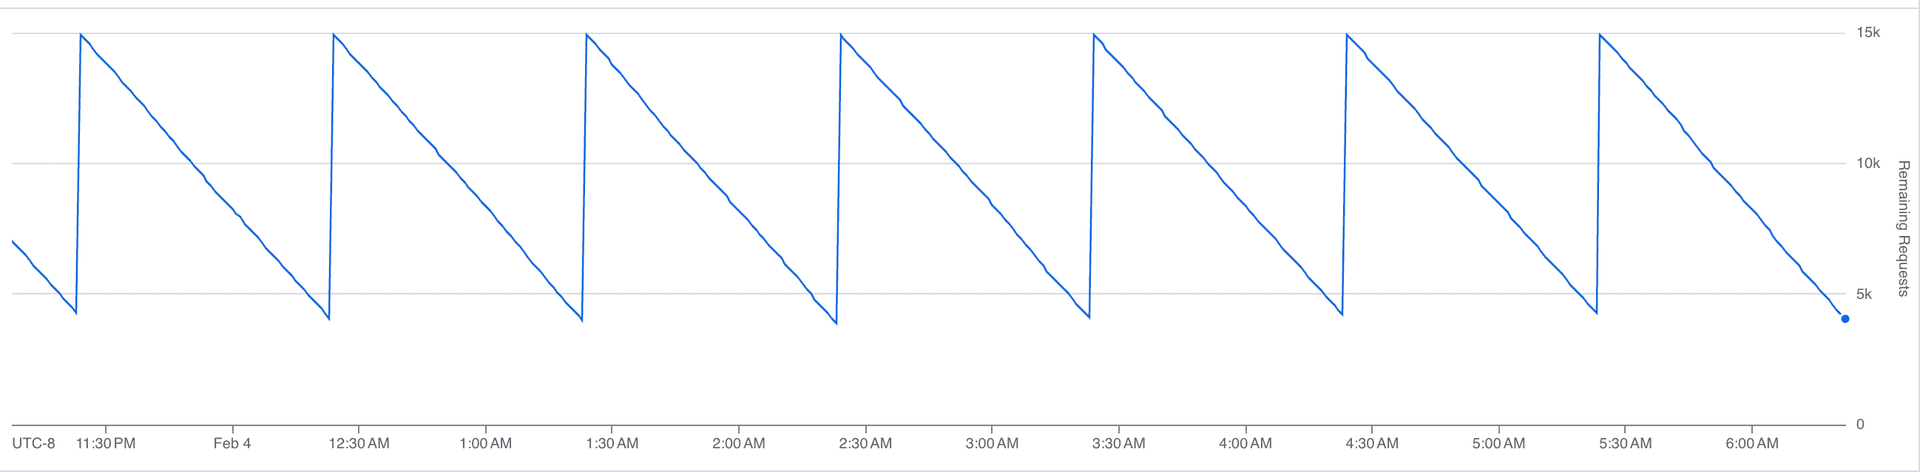
That sawtooth is the steady state. Each downward slope is us consuming API calls; each vertical jump is the hourly limit resetting. At peak, we burn through most of the budget before the window resets, with headroom left for the agent.
Once we trusted the throttling, we pushed the ingestion rate about 20% higher:

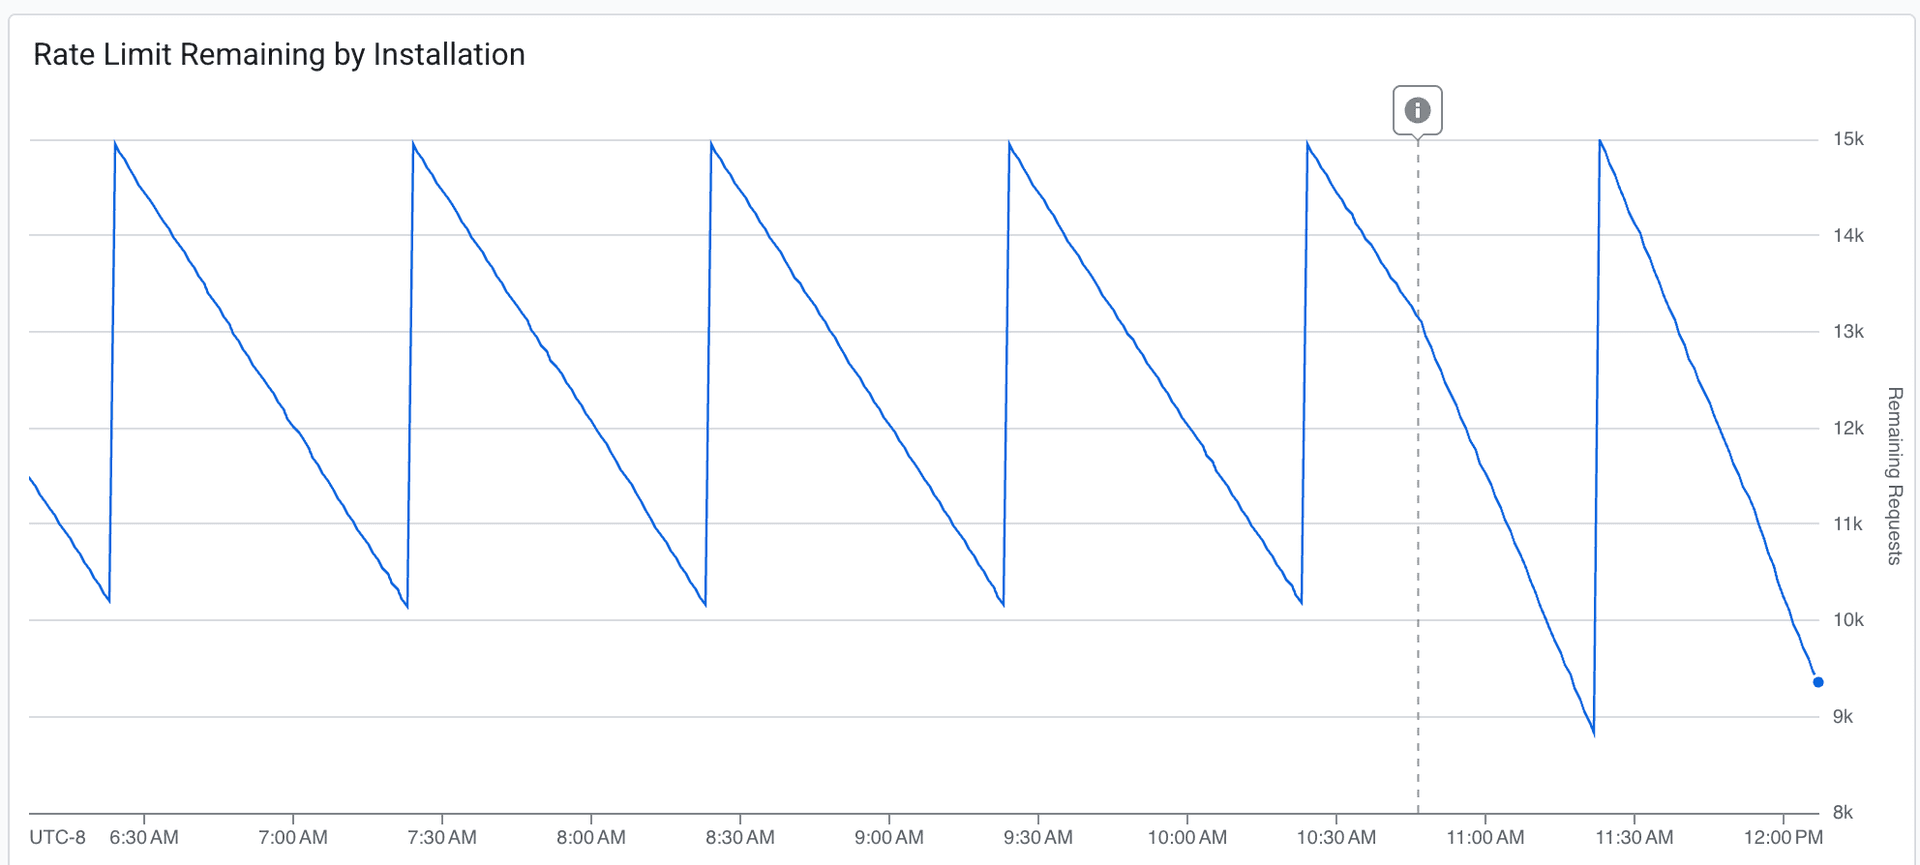
The dashed line marks the deployment. The budget draws down more aggressively after the change. We're consuming more of the available headroom per window, while still never fully exhausting it. Fresher data, acceptable margin.
We target under 5 minutes at P95 for ingestion delay, the time between an event happening on GitHub and it being queryable in our system. Most of the time, we're at a few seconds.
Both our ingestion pipeline and our agent run on Inngest, a durable execution engine. When either one hits a rate limit, it doesn't crash, retry blindly, or spin in a loop. It suspends.
GitHub's rate limit response headers tell you exactly how long you need to wait. We read that value, add 10% jitter to avoid a thundering herd when the limit resets, and suspend the execution. The full state is checkpointed: progress through the workflow, which jobs have been fetched, where we are in the log pagination.
When the wait is over, execution resumes at exactly the point it left off. No re-initialization, no duplicate work. It picks up the next API call as if nothing happened.
Compare this to the alternative: retry logic, state recovery, deduplication. Every function needs to be idempotent. Every interrupted batch needs to be reconciled. With durable execution, the rate limit is just a pause button.
CI activity is bursty. Someone merges a big PR, a release branch gets cut, three teams push at the same time. Our function throughput:

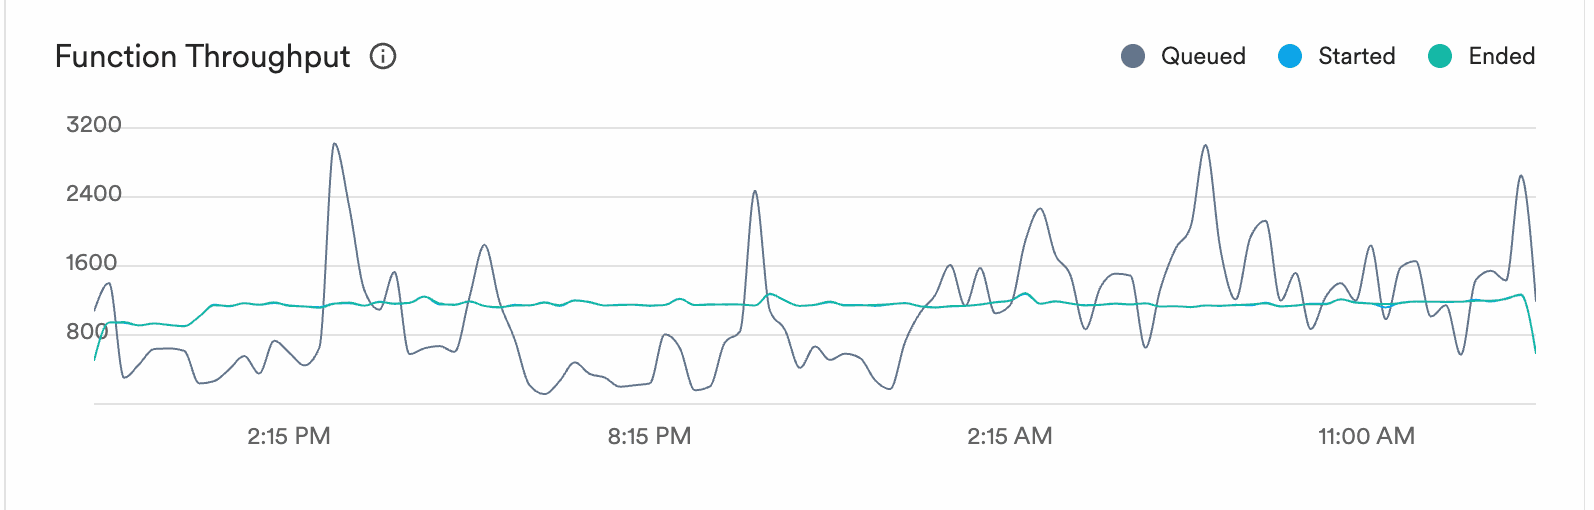
The grey line is queued work. It spikes to 3,000+ during bursts of CI activity. The blue and green lines (started and ended) stay smooth at 800-1,000. The execution engine absorbs the spikes and processes work at a steady rate.
Ingestion delay over time:

Spikes during peak activity, but the system recovers. The 5-minute P95 target holds: bursts push delay up briefly, then it drops back to seconds once the queue drains.
Nobody puts "we built a really good rate limiter" on their landing page. But without fresh, queryable data, your agent can't answer the question that actually matters: did I break this, or was it already broken?
We're building Mendral (YC W26). We spent a decade building and scaling CI systems at Docker and Dagger, and the work was always the same: stare at logs, correlate failures, figure out what changed. Now we're automating it.
In my tool I was going more of a premise that it's frequently difficult to even say what you're looking for so I wanted to have some step after reading logs to say what should be actually analyzed further which naturally requires to have some model
Same applies when picking a programming language nowadays.
Since the classifier would need to have access to the whole log message I was looking into how search is organized for the CLP compression and see that:
> First, recall that CLP-compressed logs are searchable–a user query will first be directed to dictionary searches, and only matching log messages will be decompressed.
so then yeah it can be combined with a classifier as they get decompressed to get a filtered view at only log lines that should be interesting.
The toughest part is still figuring out what does "interesting" actually mean in this context and without domain knowledge of the logs it would be difficult to capture everything. But I think it's still better than going through all the logs post searching.
And I just wanted to try MCP tooling tbh hehe Took me 2 days to create this to be honest
I'm guessing that intention was to say "around 10 lines", though it kind of stretches the definition if we're being picky.
But it's night and day to fix your CI when someone (in this case an agent) already dug into the logs, the code of the test and propose options to fix. We have several customers asking us to automate the rest (all the way to merge code), but we haven't done it for the reasons you mention. Although I am sure we'll get there sometimes this year.
Another thing SQL has in it's favor is the ability with tools like trino or datafusion to basically turn "everything" into a table.
EDIT: thinking on it some more, though, at what point do you just know off the top of your head the small handful of SQL queries you regularly use and just skip the expensive LLM step altogether? Like... that's the thing that underwhelms me about all the "natural language query" excitement. We already have a very good, natural language for queries: SQL.
- Opus agent wakes up when we detect an incident (e.g. CI broke on main)
- It looks at the big picture (e.g. which job broke) and makes a plan to investigate
- It dispatches narrowly focused tasks to Haiku sub agents (e.g. "extract the failing log patterns from commit XXX on job YYY ...")
- Sub agents use the equivalent of "tail", "grep", etc (using SQL) on a very narrow sub-set of logs (as directed by Opus) and return only relevant data (so they can interpret INFO logs as actually being the problem)
- Parent Opus agent correlates between sub agents. Can decide to spawn more sub agents to continue the investigation
It's no different than what I would do as a human, really. If there are terabytes of logs, I'm not going to read all of them: I'll make a plan, open a bunch of tabs and surface interesting bits.
O(some constant) -- "nearby" that constant (maybe "order of magnitude" or whatever is contextually convenient)
O(some parameter) -- denotes the asymptotic behavior of some parametrized process
O(some variable representing a small number) -- denotes the negligible part of something that you're deciding you don't have to care about--error terms with exponent larger than 2 for example
There are bridges here that the industry has yet to figure out. There is absolutely a place for LLMs in these workflows, and what you've done here with the Mendral agent is very disciplined, which is, I'd venture to say, uncommon. Leadership wants results, which presses teams to ship things that maybe shouldn't be shipped quite yet. IMO the industry is moving faster than they can keep up with the implications.
This isn't anything new. It's not particularly technical or novel in any way, but it seems to work pretty well for identifying anomalies and comparing series over time horizons. It's even less token efficient on small windows than piping in a bunch of json, but it seems to be more effective from an analysis point of view.
The strange thing about it is that it involves fairly deterministic analysis before we even send the data to the LLM, so one might ask, what's the point if you're already doing analysis? The answer is that LLMs can actually find interesting patterns across a lot of well presented data, and they can pick up on patterns in a way that feels like they are cross-referencing many different time series and correlate signals in interesting ways. That's where the general purpose LLMs are helpful in my experience.
Breaking out analysis into sub-agents is a logical next step, we just haven't gotten there yet.
And yeah the goal is to approximate those of us engineers who are good at RCAs in the moment, who have instincts about the system and can juggle a bunch of tabs and cross reference the signals in them.
Give those queries to the LLM and enjoy your sleep while the agent works.
Have an array of scripts to run against each log (just rust code probably for speed) and have them flag for performance, errors, intrusions, etc...