The Query Tool is a powerful, feature-rich environment that allows you to execute arbitrary SQL commands and review the result set. You can access the Query Tool via the Query Tool menu option on the Tools menu, or through the context menu of select nodes of the Object explorer control. The Query Tool allows you to:
Issue ad-hoc SQL queries.
Execute arbitrary SQL commands.
Edit the result set of a SELECT query if it is updatable.
Displays current connection and transaction status as configured by the user.
Save the data displayed in the output panel to a CSV file.
Review the execution plan of a SQL statement in either a text, a graphical format or a table format (similar to https://explain.depesz.com).
View analytical information about a SQL statement.
You can open multiple copies of the Query tool in individual tabs simultaneously. To close a copy of the Query tool, click the X of the tab.
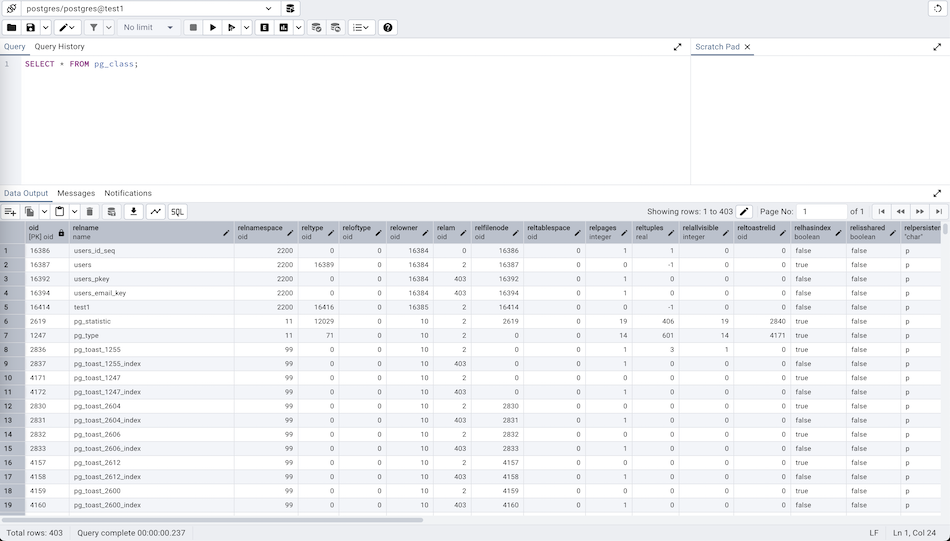
The Query Tool features two panels:
The upper panel displays the SQL Editor. You can use the panel to enter, edit, or execute a query or a script. It also shows the History tab which can be used to view the queries that have been executed in the session, a Scratch Pad which can be used to hold text snippets during editing, and an AI Assistant tab for generating SQL from natural language (when AI is configured). If the Scratch Pad is closed, it can be re-opened (or additional ones opened) by right-clicking in the SQL Editor and other panels and adding a new panel.
The lower panel displays the Data Output panel. The tabbed panel displays the result set returned by a query, information about a query’s execution plan, server messages related to the query’s execution and any asynchronous notifications received from the server.
Query Tool in Workspace Layout
The workspace layout offers a distraction-free, dedicated area for the Query Tool. When the Query Tool workspace is accessed, the Welcome page opens by default.
Note: In the Workspace layout, all Query Tool and View/Edit Data tabs open within the Query Tool workspace.
In the classic UI, users must connect to a database server and navigate to the database node before using the Query Tool. However, with the introduction of the Workspace layout and Welcome page, users can seamlessly connect to any ad-hoc server, even if it is not registered in the Object Explorer.
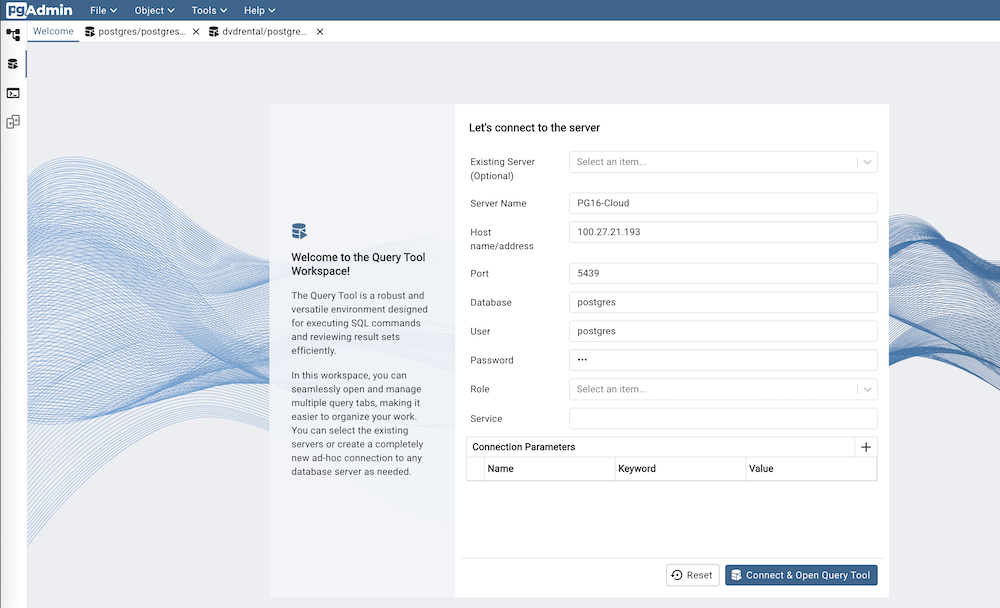
Select Existing Server from the dropdown to connect to a server already listed in the Object Explorer. It is optional.
Provide the Server Name for ad-hoc servers.
Specify the IP address of the server host, or the fully qualified domain name in the Host name/address field.
Enter the listener port number of the server host in the Port field.
Use the Database field to specify the name of the database to which the client will connect.
Use the User field to specify the name of a user that will be used when authenticating with the server.
Use the Password field to provide a password that will be supplied when authenticating with the server.
Use the Role field to specify the name of a role that has privileges that will be conveyed to the client after authentication with the server.
Use the Service field to specify the service name. For more information, see Section 33.16 of the Postgres documentation.
Use the fields in the Connection Parameters to configure the connection parameters.
After filling in all the required fields, click the Connect & Open Query Tool button to launch the Query Tool with the provided server details. If the password is not supplied, you will be prompted to enter it.
Toolbar
The toolbar is described in the following subsections.
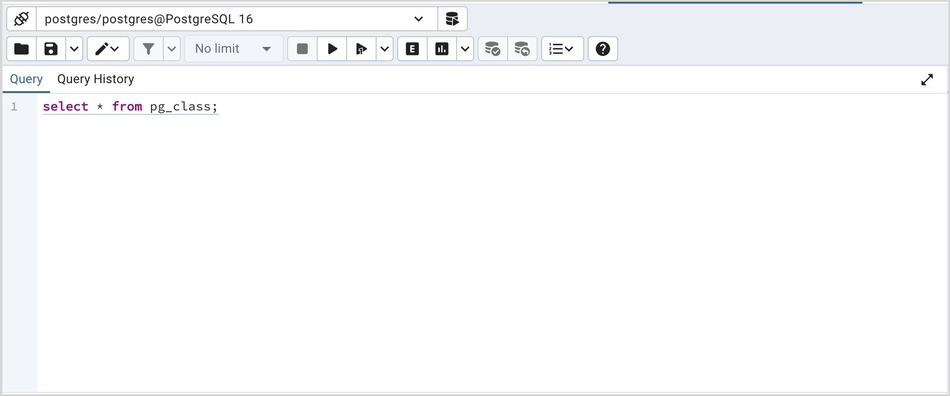
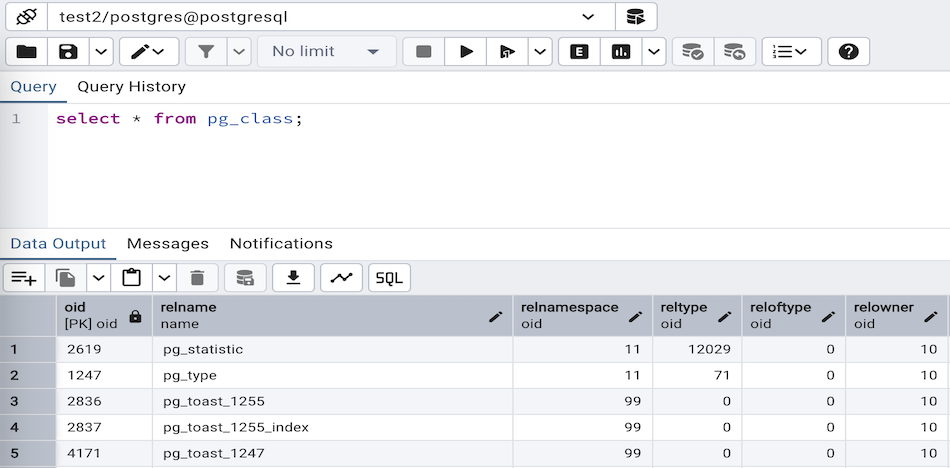
The SQL Editor Panel
The SQL editor panel is a workspace where you can manually provide a query, copy a query from another source, or read a query from a file. The SQL editor features syntax coloring and autocompletion.
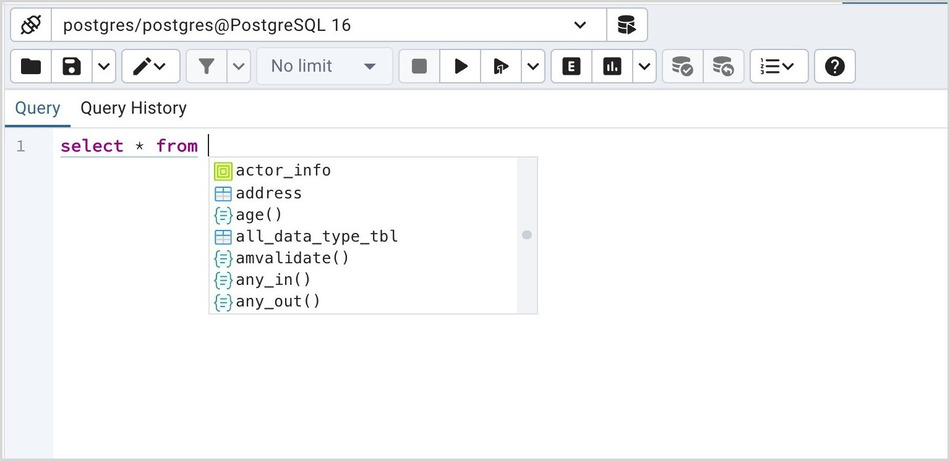
To use autocomplete, begin typing your query; when you would like the Query editor to suggest object names or commands that might be next in your query, press the Control+Space key combination. For example, type “SELECT * FROM” (without quotes, but with a trailing space), and then press the Control+Space key combination to select from a popup menu of autocomplete options.
After entering a query, select the Execute script icon from the toolbar. The complete contents of the SQL editor panel will be sent to the database server for execution. To execute only a section of the code that is displayed in the SQL editor, highlight the text that you want the server to execute, and click the Execute script icon.
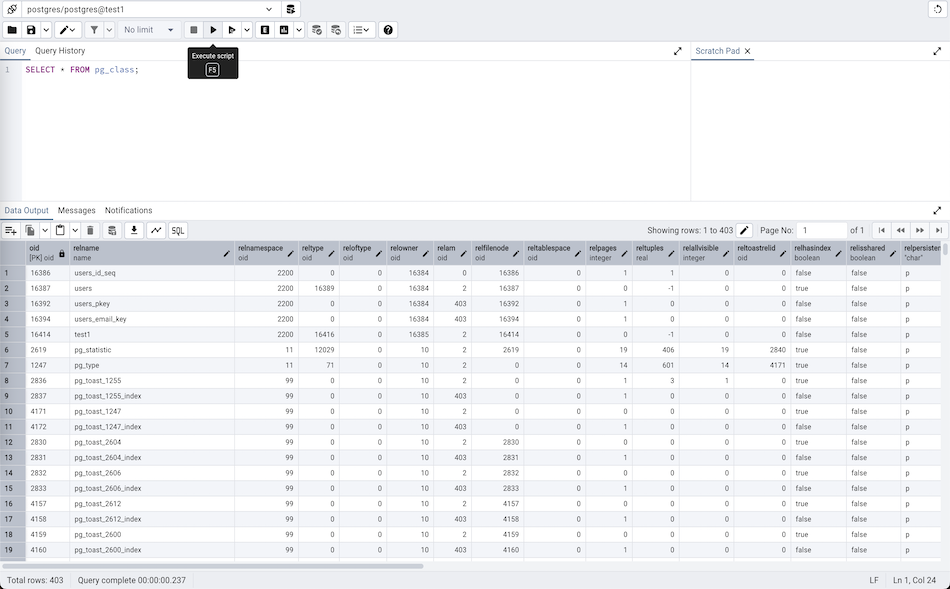
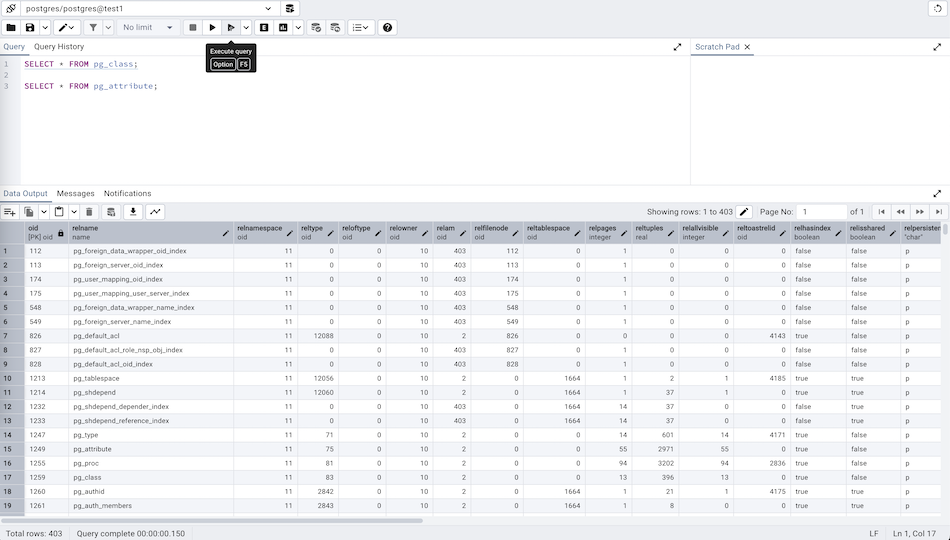
You can also execute a query based on cursor position. Query tool will detect a query and underline it when cursor position changes. Now, to execute the current underlined query, hit the Execute query button on the toolbar. If a section is highlighted then it will behave like normal execute.
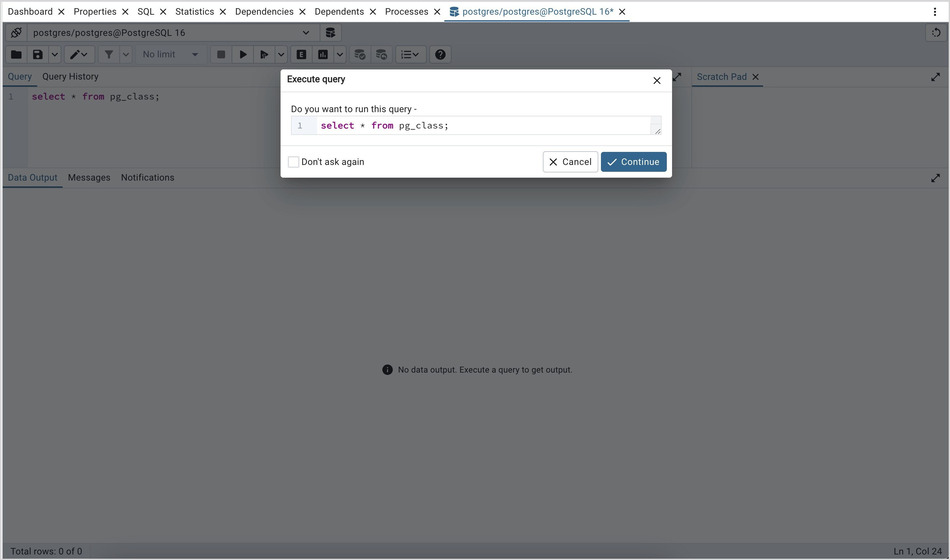
The warning will appear only if Underline query at cursor? is set to False and the Underlined query execute warning? switch is set to True Preferences Query tool’s Options.
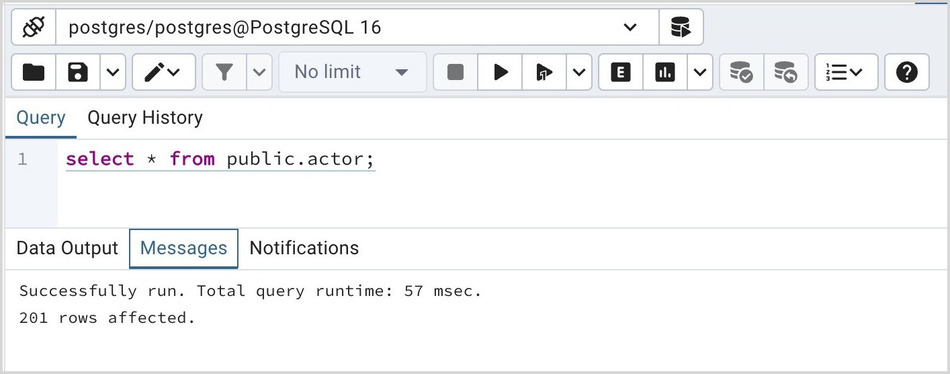
The message returned by the server when a command executes is displayed on the Messages tab. If the command is successful, the Messages tab displays execution details.
Options on the Edit menu offer functionality that helps with code formatting and commenting:
The auto-indent feature will automatically indent text to the same depth as the previous line when you press the Return key.
Block indent text by selecting two or more lines and pressing the Tab key.
Implement or remove SQL style or toggle C style comment notation within your code.
You can also drag and drop certain objects from the treeview which can save time in typing long object names. Text containing the object name will be fully qualified with schema. Double quotes will be added if required. For functions and procedures, the function name along with parameter names will be pasted in the Query Tool.
Query History Panel
Use the Query History tab to review activity for the current session:
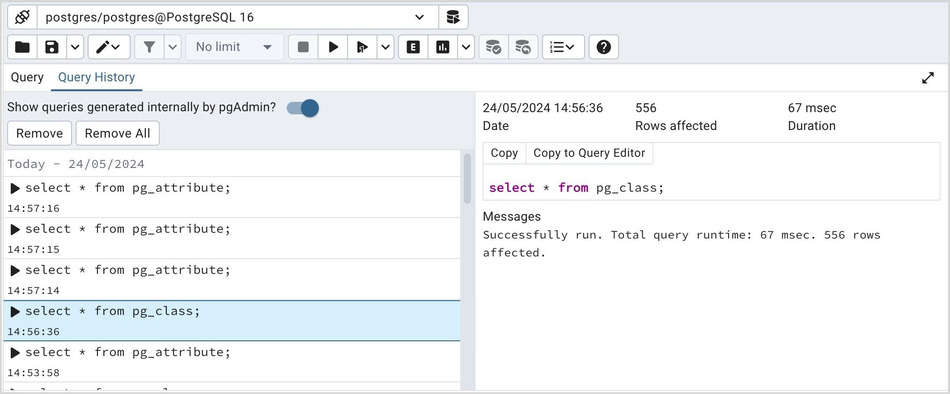
The Query History tab displays information about recent commands:
The date and time that a query was invoked.
The text of the query.
The number of rows returned by the query.
The amount of time it took the server to process the query and return a result set.
Messages returned by the server (not noted on the Messages tab).
The source of the query (indicated by icons corresponding to the toolbar).
You can show or hide the queries generated internally by pgAdmin (during ‘View/Edit Data’ or ‘Save Data’ operations).
You can remove a single query by selecting it and clicking on the Remove button. If you would like to remove all of the histories from the Query History tab, then click on the Remove All button.
By using the Copy button, you can copy a particular query to the clipboard, and with the Copy to Query Editor button, you can copy a specific query to the Query Editor tab. During this operation, all existing content in the Query Editor is erased.
Query History is maintained across sessions for each database on a per-user basis when running in Query Tool mode. In View/Edit Data mode, history is not retained. By default, the last 20 queries are stored for each database. This can be adjusted in config_local.py or config_system.py (see the config.py documentation) by overriding the MAX_QUERY_HIST_STORED value. See the Deployment section for more information.
AI Assistant Panel
The AI Assistant tab provides a chat-style interface for generating SQL queries from natural language descriptions. This feature requires an AI provider to be configured in Preferences > AI. For configuration details, see the Preferences documentation.
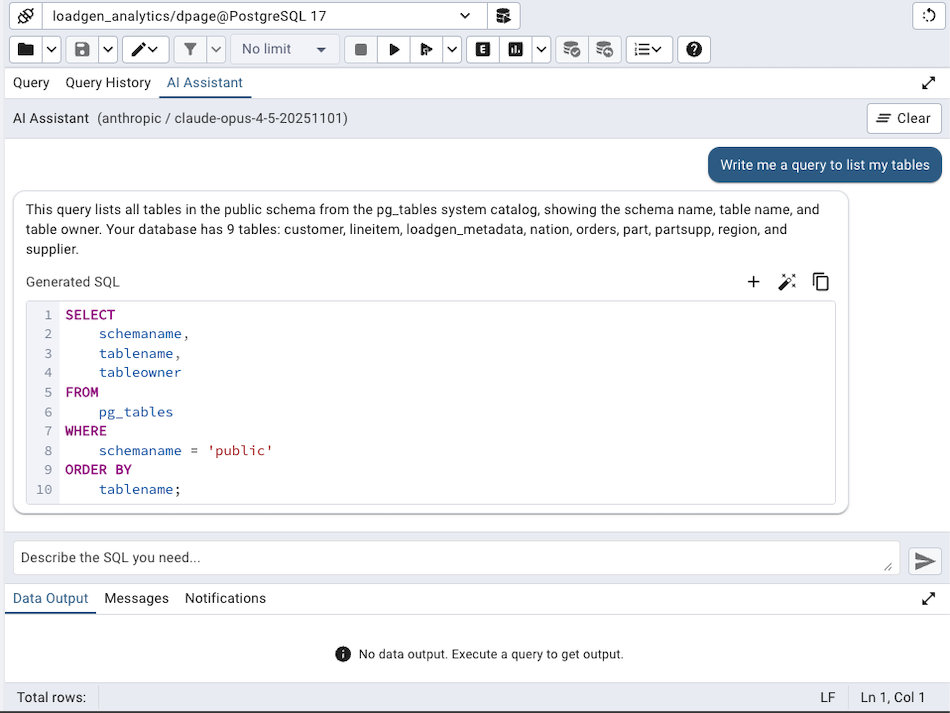
To use the AI Assistant:
Click on the AI Assistant tab in the upper panel, or use the AI Assistant toolbar button.
Type a description of the SQL query you need in natural language.
Press Enter or click the send button to submit your request.
The AI will analyze your database schema and generate appropriate SQL.
The AI Assistant displays conversations with your messages and AI responses. When the AI generates SQL, it appears in a syntax-highlighted code block with action buttons:
Insert - Insert the SQL at the current cursor position in the SQL Editor.
Replace - Replace all content in the SQL Editor with the generated SQL.
Copy - Copy the SQL to the clipboard.
The AI Assistant maintains conversation context, allowing you to refine queries iteratively. For example, you can ask for a query and then follow up with “also add a filter for active users” to modify the previous result.
Tips for effective use:
Be specific about table and column names if you know them.
Describe the desired output format (e.g., “show count by category”).
For complex queries, break down requirements step by step.
Use the Clear button to start a fresh conversation.
Note: The AI Assistant uses database schema inspection tools to understand your database structure. It supports SELECT, INSERT, UPDATE, DELETE, and DDL statements. All generated queries should be reviewed before execution.
The Data Output Panel
The Data Output panel displays data and statistics generated by the most recently executed query.
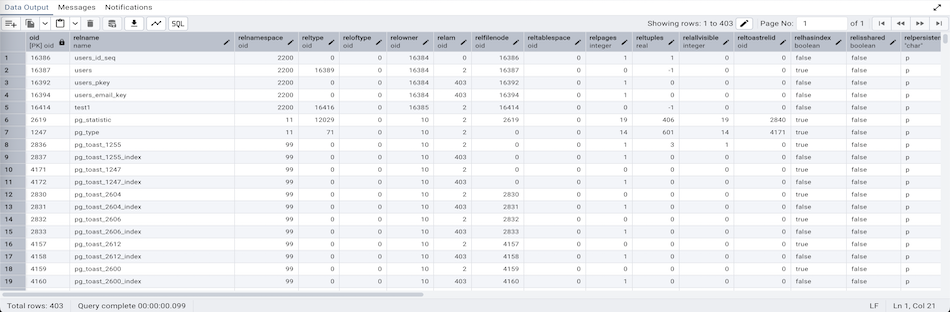
The Data Output tab displays the result set of the query in a table format. You can:
Select and copy from the displayed result set.
Use the Save results to file icon to save the content of the Data Output tab as a comma-delimited file.
Edit the data in the result set of a SELECT query if it is updatable.
Move between pages of data result.
A result set is updatable if:
All columns are either selected directly from a single table, or are not table columns at all (e.g. concatenation of 2 columns). Only columns that are selected directly from the table are editable, other columns are read-only.
All the primary key columns or OIDs of the table are selected in the result set.
Any columns that are renamed or selected more than once are also read-only.
Editable and read-only columns are identified using pencil and lock icons (respectively) in the column headers.
The psycopg2 driver version should be equal to or above 2.8 for updatable query result sets to work.
An updatable result set is identical to the Data Grid in View/Edit Data mode, and can be modified in the same way.
If Auto-commit is off, the data changes are made as part of the ongoing transaction, if no transaction is ongoing a new one is initiated. The data changes are not committed to the database unless the transaction is committed.
If any errors occur during saving (for example, trying to save NULL into a column with NOT NULL constraint) the data changes are rolled back to an automatically created SAVEPOINT to ensure any previously executed queries in the ongoing transaction are not rolled back.
All rowsets from previous queries or commands that are displayed in the Data Output panel will be discarded when you invoke another query; open another Query Tool tab to keep your previous results available.
Explain Panel
To generate the Explain or Explain Analyze plan of a query, click on Explain or Explain Analyze button in the toolbar.
More options related to Explain and Explain Analyze can be selected from the drop down on the right side of Explain Analyze button in the toolbar.
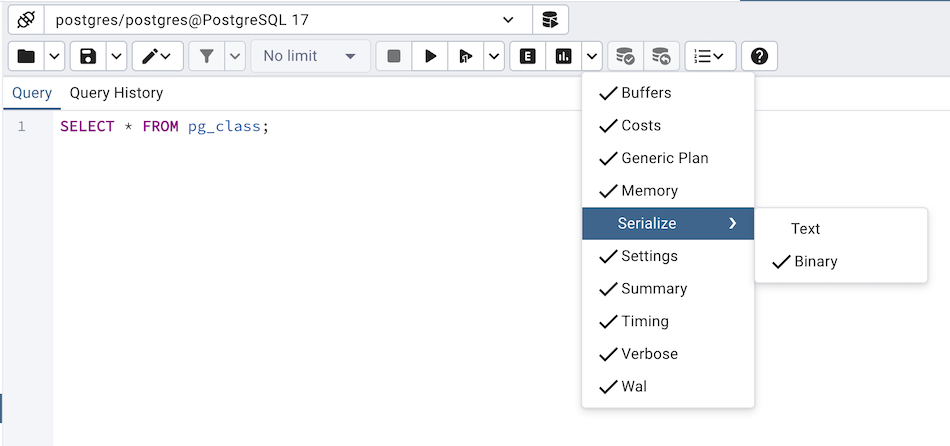
Please note that pgAdmin generates the Explain [Analyze] plan in JSON format.
Note: If multiple queries are present and none is selected, Explain [Analyze] runs the query located at the cursor position.
On successful generation of Explain plan, it will create three tabs/panels under the Explain panel.
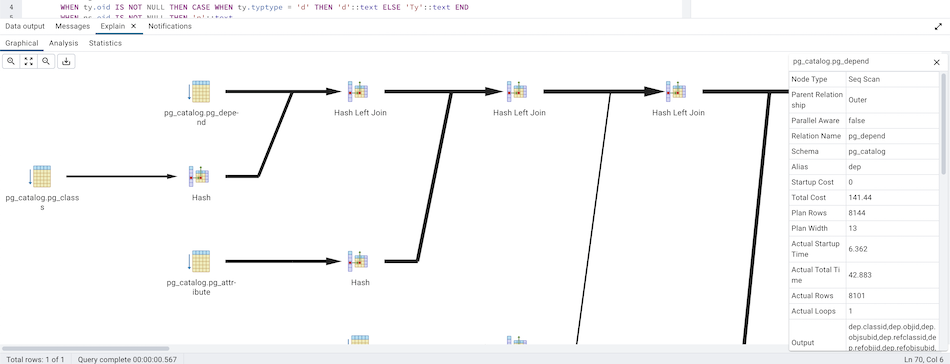
- Graphical
Please note that EXPLAIN VERBOSE cannot be displayed graphically. Click on a node icon on the Graphical tab to review information about that item; a popup window will display on the right side with the information about the selected object. For information on JIT statistics, triggers and a summary, click on the button on top-right corner; a similar popup window will be displayed when appropriate.
Use the download button on top left corner of the Explain canvas to download the plan as an SVG file.
Note: Download as SVG is not supported on Internet Explorer.
Note that the query plan that accompanies the Explain analyze is available on the Data Output tab.
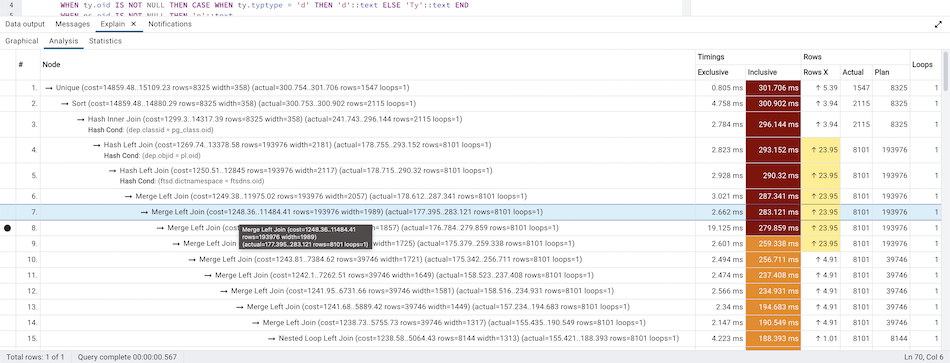
- Table
Table tab shows the plan details in table format, it generates table format similar to explain.depesz.com. Each row of the table represent the data for a Explain Plan Node. It may contain the node information, exclusive timing, inclusive timing, actual vs planned rows differences, actual rows, planned rows, loops.
background color of the exclusive, inclusive, and Rows X columns may vary based on the difference between actual vs planned.
If percentage of the exclusive/inclusive timings of the total query time is: > 90 - Red color > 50 - Orange (between red and yellow) color > 10 - Yellow color
If planner mis-estimated number of rows (actual vs planned) by 10 times - Yellow color 100 times - Orange (between Red and Yellow) color 1000 times - Red color
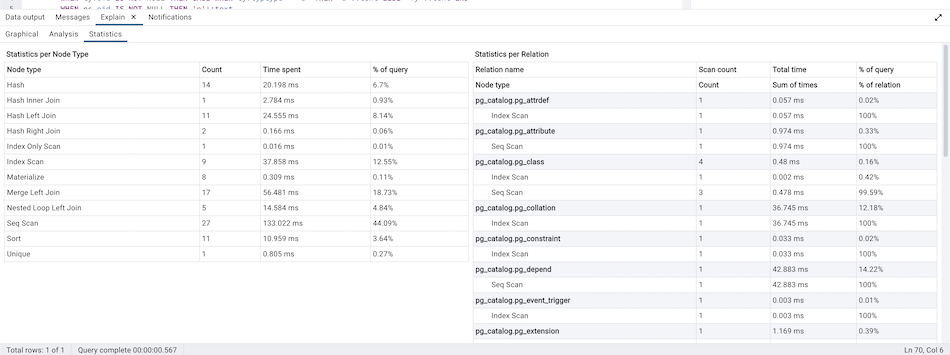
- Statistics
Statistics tab shows two tables: 1. Statistics per Plan Node Type 2. Statistics per Table
- AI Insights
The AI Insights tab provides AI-powered analysis of query execution plans, identifying performance bottlenecks and suggesting optimizations. This tab is only available when an AI provider is configured in Preferences > AI.
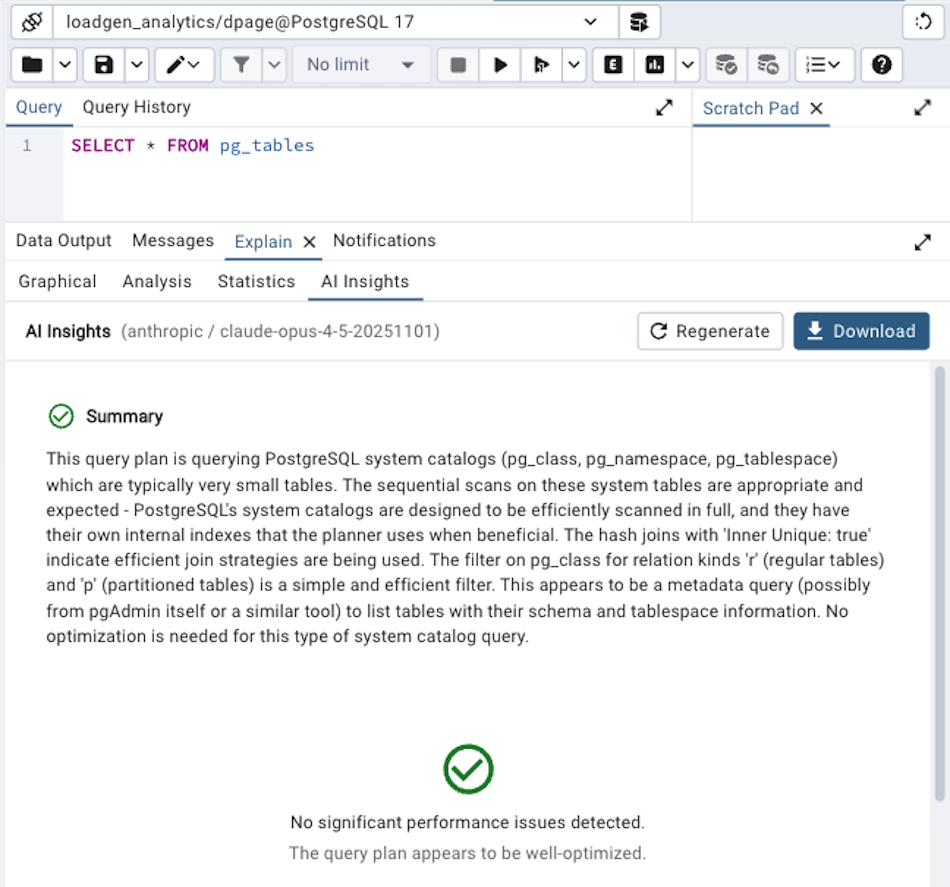
When you switch to the AI Insights tab, the AI analyzes the execution plan and provides:
Performance Bottlenecks - Issues identified in the query plan, such as:
Sequential scans on large tables that could benefit from indexes
Significant differences between estimated and actual row counts
Expensive sort or hash operations
Nested loops with high iteration counts
Recommendations - Concrete suggestions to improve query performance:
Index creation statements with appropriate columns
ANALYZE commands to update table statistics
Configuration parameter adjustments
Query restructuring suggestions
Each recommendation that includes SQL (such as CREATE INDEX statements) has action buttons to Copy the SQL to the clipboard or Insert it into the Query Editor.
Click the Regenerate button to request a fresh analysis of the current plan.
Note: AI analysis is generated on-demand when you first click the AI Insights tab or when a new explain plan is generated while the tab is active. The analysis provides guidance but all suggested changes should be carefully evaluated before applying to production databases.
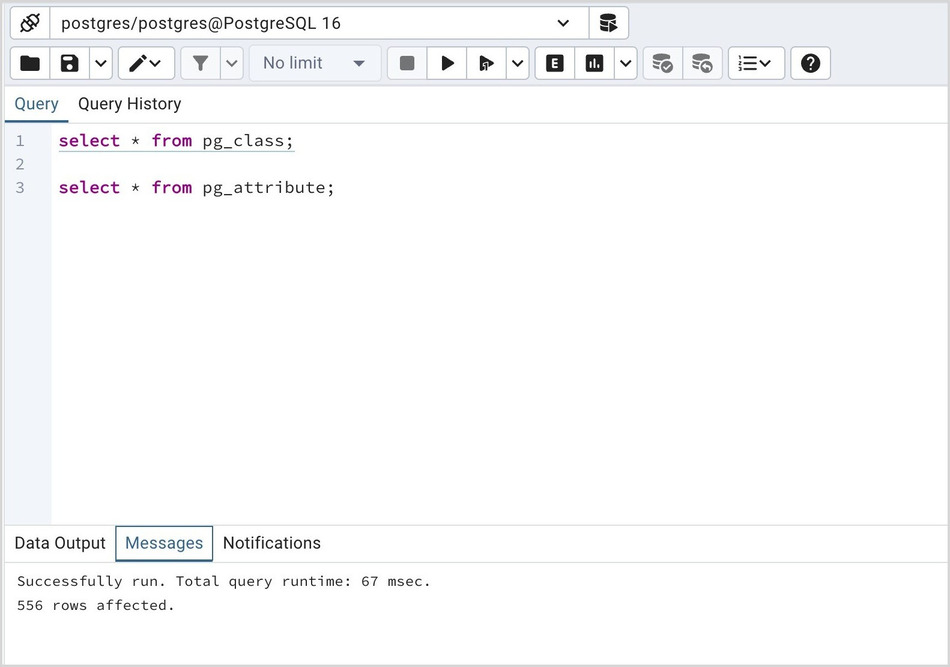
Messages Panel
Use the Messages tab to view information about the most recently executed query:
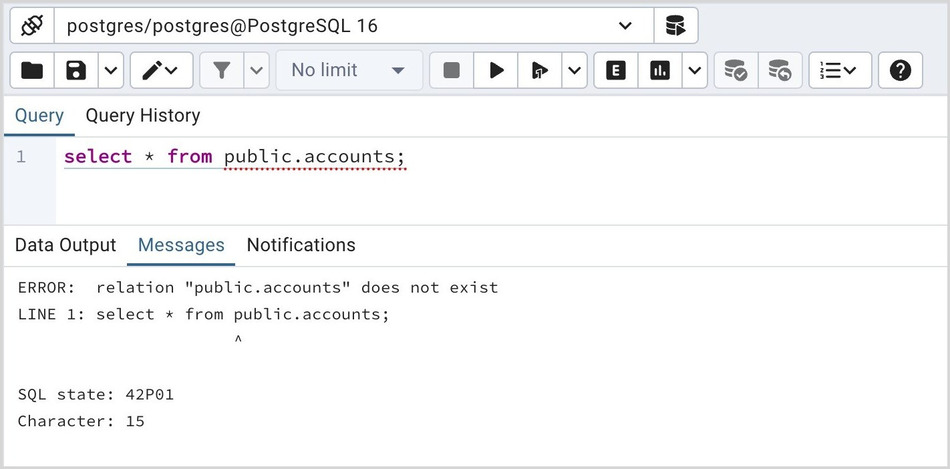
If the server returns an error, the error message will be displayed on the Messages tab, and the syntax that caused the error will be underlined in the SQL editor. If a query succeeds, the Messages tab displays how long the query took to complete and how many rows were retrieved:
Notifications Panel
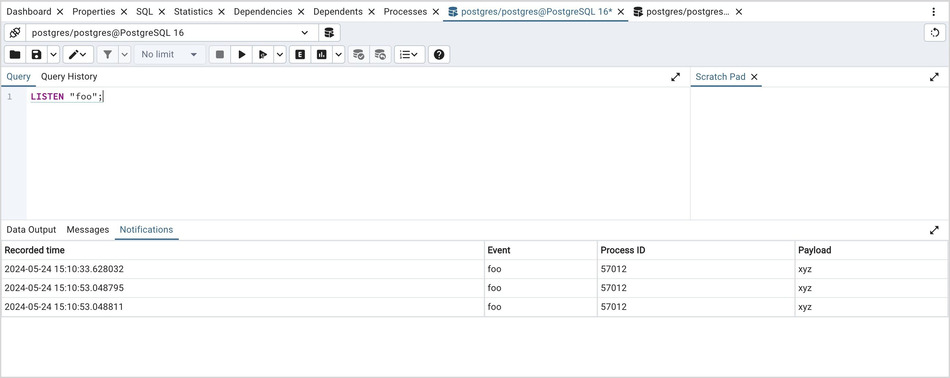
Use the Notifications tab to view the notifications using PostgreSQL Listen/ Notify feature. For more details see PostgreSQL documentation.
Example:
- Execute LISTEN “foo” in first Query Tool session
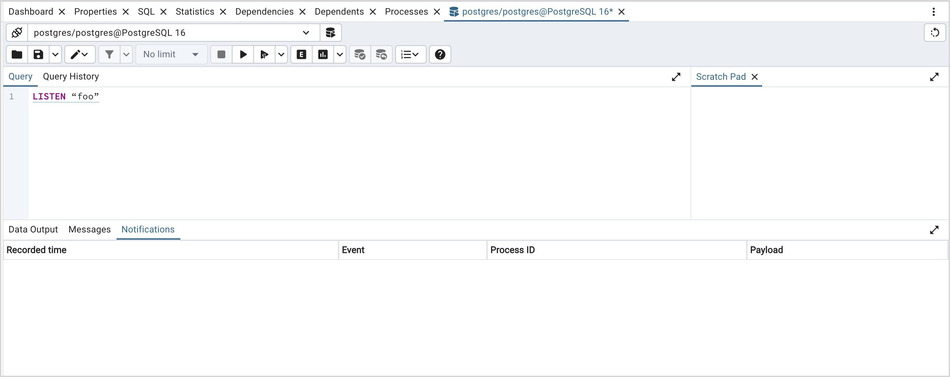
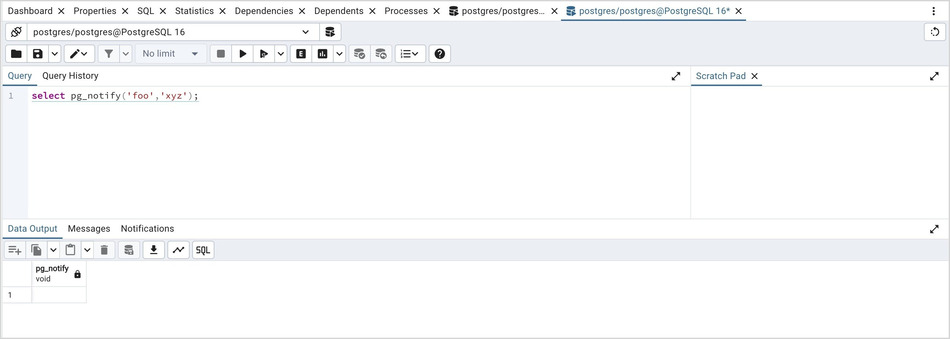
2. In the another Query Tool session, execute Notify command or pg_notify function to send the notification of the event together with the payload.
3. You can observe the Notification tab in the first Query Tool session where it shows the Recorded time, Event, Process ID, and the Payload of the particular channel.
Graph Visualiser Panel
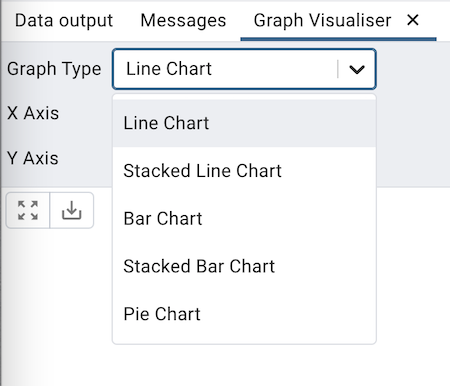
Click the Graph Visualiser button in the toolbar to generate the Graphs of the query results. The graph visualiser supports Line Charts, Stacked Line Charts, Bar Charts, Stacked Bar Charts, and Pie Charts.
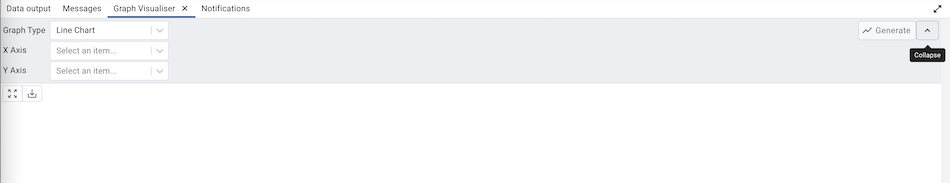
- Graph Type
Choose the type of the graph that you would like to generate.
- X Axis
Choose the column whose value you wish to display on X-axis from the X Axis dropdown. Select the option to use the number of rows as labels on the X-axis.
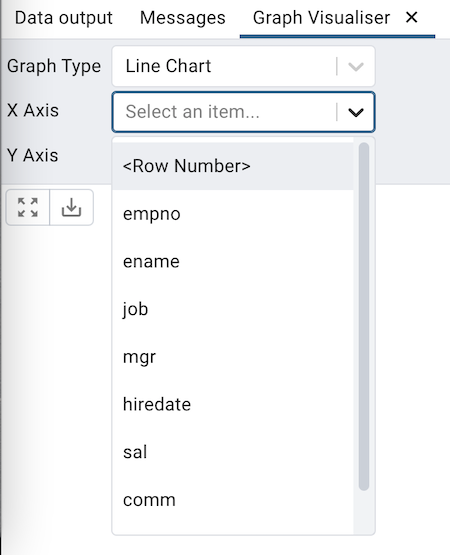
- Y Axis
Choose the columns whose value you wish to display on Y-axis from the Y Axis dropdown. Users can choose multiple columns. Choose the