How do you let users write arbitrary SQL against a shared multi-tenant analytical database without exposing other tenants' data or letting a rogue query take down the cluster?
That's the problem we needed to solve for Query & Dashboards. The answer is TRQL (Trigger Query Language), a SQL-style language that compiles to secure, tenant-isolated ClickHouse queries. Users write familiar SQL. TRQL handles the security, the abstraction, and the translation.
This post is a deep dive into how it all works. We'll cover the language design, the compilation pipeline, the schema system, and the features that make TRQL more than just a SQL passthrough.
Why build a DSL?
A DSL (domain-specific language) is a language designed for a particular problem domain. CSS is a DSL for styling. SQL is a DSL for querying databases. TRQL is a DSL for querying Trigger.dev data.
We could have exposed raw ClickHouse SQL directly. But there are three reasons we didn't:
1. The language itself is a security boundary. By defining our own grammar, we control exactly what operations are possible. INSERT, UPDATE, DELETE, DROP, and any ClickHouse function we haven't explicitly allowed simply don't exist in the language. This isn't validation that rejects dangerous queries; the parser physically cannot produce them. We cover this in more detail in the ANTLR section below.
2. Tenant isolation must be compiler-enforced, not user-trusted. In a multi-tenant system, every query must be scoped to the requesting organization. If we relied on users including WHERE organization_id = '...' in their queries, a missing filter would leak data across tenants. TRQL injects these filters automatically during compilation. There's no way to opt out.
3. Internal database details should be hidden. Our ClickHouse tables have names like trigger_dev.task_runs_v2 and columns like cost_in_cents and base_cost_in_cents. Users shouldn't need to know any of that. TRQL lets them write SELECT total_cost FROM runs while the compiler handles the translation.
4. We need features that don't exist in ClickHouse. Virtual columns, automatic time bucketing, value transforms, and rendering metadata are all things we've built into TRQL's schema layer. A raw SQL passthrough couldn't provide any of this.
A big thanks to PostHog who pioneered this approach with HogQL, a SQL-like interface on top of ClickHouse. TRQL started as a TypeScript conversion of their Python implementation but evolved significantly during development to handle our specific use cases.
Why ClickHouse?
Before we get into the language itself, it helps to understand the target. We chose ClickHouse as the analytical backend because it excels at exactly this kind of workload:
- Columnar storage: Queries only read the columns they need, so a query selecting
statusandtotal_costdoesn't touchoutput,error, or any other column - Incredible performance: Handles billions of rows with sub-second query times for typical aggregations
- Rich SQL: JSON extraction, complex aggregations, percentile functions, text search, and more
- Battle-tested: Used by Cloudflare, Uber, eBay, and many others at scale
If you want to know more about how we run ClickHouse in production, we wrote a postmortem on a partitioning incident that goes into the internals.
Parsing with ANTLR
TRQL is parsed using ANTLR, a parser generator that takes a formal grammar definition and produces a lexer and a parser. The lexer breaks the raw query text into tokens (keywords, identifiers, operators, string literals). The parser takes those tokens and arranges them into a structured tree based on the grammar rules. You write the grammar, ANTLR generates the code for both.
This is important for security. The grammar defines what the language can express. If DELETE, UPDATE, DROP, or SET aren't in the grammar, they can never appear in a parsed query. It's not that we validate and reject them. They literally don't exist in TRQL's syntax. This is security by construction, not by validation.
TRQL's grammar is a strict subset of SQL. If you've written SQL before, TRQL will feel completely familiar. SELECT, FROM, WHERE, GROUP BY, ORDER BY, LIMIT, and common aggregation functions all work as expected. But the grammar is physically incapable of expressing writes or administrative commands.
Our ANTLR grammar targets TypeScript and produces a full abstract syntax tree (AST) for each query. The AST is a structured tree representation of the query that the compiler can inspect, validate, and transform. Every subsequent step in the pipeline operates on this AST rather than on raw text.
For example, the query SELECT task_identifier, SUM(total_cost) FROM runs WHERE status = 'Failed' produces this tree:
SelectStatement
├── SelectList
│ ├── SelectListItem
│ │ └── ColumnReference: task_identifier
│ └── SelectListItem
│ └── AggregateFunctionCall: SUM
│ └── ColumnReference: total_cost
├── FromClause
│ └── TableReference: runs
└── WhereClause
└── ComparisonExpression (=)
├── ColumnReference: status
└── StringLiteral: 'Failed'
Each node in the tree is something the compiler can reason about. It can check that runs is a valid table, that task_identifier and total_cost exist on that table, that SUM is an allowed function, and that 'Failed' is a valid value for the status column.
The compilation pipeline
Once parsed, the AST goes through a series of transformations before it becomes executable ClickHouse SQL. Here's each step:
Parse: The TRQL query is parsed into an AST using ANTLR. Only constructs that exist in the grammar can make it this far. Anything else is a syntax error.
Schema validation: We walk the AST and check every identifier against the table schemas. Does the table exist? Do all the referenced columns exist on that table? Are the functions valid? Are the argument types correct? If you write
WHERE status = 123butstatusis a string column with allowed values, this step catches it.Tenant isolation: We inject tenant-specific filters into the
WHEREclause. At a minimum, every query gets anorganization_idfilter. Depending on the query scope, we also addproject_idandenvironment_idfilters. These are added to the AST itself, so they're baked into the query structure before any SQL is generated. Without this step, any user could read any other organization's data.Time restrictions: We add time bounds to prevent unbounded scans. Without this, a simple
SELECT * FROM runswould attempt to scan the entire table history. The maximum queryable time range varies by plan on Trigger.dev Cloud.Parameterize values: All literal values in the query (strings, numbers, dates) are extracted from the AST and replaced with named parameters like
{tsql_val_0: String}. The actual values are passed separately to ClickHouse rather than being interpolated into the SQL string. Combined with the grammar restrictions from the parsing step, this means the generated ClickHouse SQL is always structurally safe.Generate ClickHouse SQL: The transformed AST is "printed" into ClickHouse-compatible SQL. This is where virtual columns are expanded to their real expressions, table names are translated, and TRQL-specific functions are compiled to their ClickHouse equivalents.
Execute: The generated SQL is executed against ClickHouse in read-only mode. On Trigger.dev Cloud, queries run against a dedicated read-only replica to avoid impacting write performance.
Return results: Results come back in JSON format, along with column metadata that tells the UI how to render each value.
Here's the full pipeline visualized:
Example: TRQL in, ClickHouse out
Let's make this concrete. Here's a simple TRQL query that finds the cost of each task:
SELECT
task_identifier,
SUM(total_cost) AS cost
FROM
runs
GROUP BY
task_identifier
And here's the parameterized ClickHouse SQL that TRQL generates:
SELECT
task_identifier,
-- `total_cost` is actually the sum of two columns and needs converting to dollars
sum(((cost_in_cents + base_cost_in_cents) / 100.0)) AS cost
-- Table names are translated and FINAL is used to avoid stale data
FROM trigger_dev.task_runs_v2 AS runs FINAL
WHERE
and(
and(
-- Tenant isolation: organization
equals(runs.organization_id, {tsql_val_0: String}),
),
-- Time restriction
greaterOrEquals(created_at, toDateTime64({tsql_val_1: String}, 3))
)
GROUP BY task_identifier
-- We limit results to 10k rows (we return an extra so we can tell the user if there are more)
LIMIT 10001;
Every step from the pipeline is visible here:
total_costis a virtual column. Users writeSUM(total_cost)but TRQL expands it tosum(((cost_in_cents + base_cost_in_cents) / 100.0)). The user never needs to know that costs are stored as two separate cent values in ClickHouse.- Table names are translated from the user-friendly
runsto the actualtrigger_dev.task_runs_v2table. TheFINALkeyword tells ClickHouse to read the latest merged data, which matters because ClickHouse uses a MergeTree engine that can have unmerged parts. - Tenant isolation is injected automatically via
equals(runs.organization_id, {tsql_val_0: String}). There's no way to query data from another organization because this filter is added by the compiler, not the user. - Time restrictions are added via
greaterOrEquals(created_at, ...). Without this, the query would scan the entire history of the table. - Parameterized values like
{tsql_val_0: String}prevent SQL injection. The actual organization ID and timestamp are passed as separate parameters to ClickHouse, never interpolated into the query string. - Row limits are automatically applied. We request 10,001 rows so we can tell the user "there are more results" while only returning 10,000.
Schema design
The schema definition is where a lot of TRQL's power comes from. Each table is defined as a TypeScript object that describes not just the columns, but how they should be translated, validated, and rendered. Here's what's interesting about it.
Two tables
TRQL currently exposes two tables:
runs: Every task run, including status, timing, costs, machine type, tags, error data, and other metadata. This is the primary table for understanding what your tasks are doing.metrics: CPU utilization, memory usage, and any custom metrics you record via OpenTelemetry. Metrics are pre-aggregated into 10-second buckets for efficient querying.
Virtual columns
Some of the most useful columns in TRQL don't exist in ClickHouse at all. They're defined as expressions that the compiler expands during query generation.
total_cost is a good example. In ClickHouse, costs are stored as two separate integer columns: cost_in_cents (compute cost) and base_cost_in_cents (invocation cost). The schema defines total_cost as:
total_cost: {
name: "total_cost",
expression: "(cost_in_cents + base_cost_in_cents) / 100.0",
// ...
}
When a user writes SELECT total_cost FROM runs, TRQL expands it to (cost_in_cents + base_cost_in_cents) / 100.0. The user gets a clean dollar amount without knowing about the internal storage format.
Other virtual columns follow the same pattern:
| User-facing column | Expression |
|---|---|
execution_duration |
dateDiff('millisecond', executed_at, completed_at) |
total_duration |
dateDiff('millisecond', created_at, completed_at) |
queued_duration |
dateDiff('millisecond', queued_at, started_at) |
is_finished |
if(status IN ('COMPLETED_SUCCESSFULLY', ...), true, false) |
is_root_run |
if(depth = 0, true, false) |
Users write WHERE execution_duration > 5000 and the compiler handles the rest.
Column renaming
ClickHouse column names are database artifacts. TRQL renames them to domain concepts:
| TRQL name | ClickHouse name |
|---|---|
run_id |
friendly_id |
triggered_at |
created_at |
machine |
machine_preset |
attempt_count |
attempt |
dequeued_at |
started_at |
This means we can refactor our ClickHouse schema without breaking user queries. The TRQL names are the stable public API.
Value transforms
Some columns need their values transformed at the boundary. For example, run IDs are stored in ClickHouse without a prefix, but users expect to write WHERE run_id = 'run_cm1a2b3c4d5e6f7g8h9i'. The schema defines a whereTransform that strips the run_ prefix before the value hits ClickHouse:
root_run_id: {
name: "root_run_id",
expression: "if(root_run_id = '', NULL, 'run_' || root_run_id)",
whereTransform: (value: string) => value.replace(/^run_/, ""),
// ...
}
The expression adds the prefix when reading (so results display run_...), and whereTransform strips it when filtering. Users never need to think about how IDs are stored internally. The same pattern applies to batch_id (stripping batch_) and parent_run_id.
Column metadata for rendering
Each column carries metadata that tells the UI how to display its values. The customRenderType field controls this:
| Render type | Behavior |
|---|---|
runId |
Displayed as a clickable link to the run |
duration |
Formatted as human-readable time (e.g. "3.5s") |
costInDollars |
Formatted as currency |
runStatus |
Rendered with colored status badges |
tags |
Displayed as tag chips |
environment |
Resolved to the environment slug |
This metadata is returned alongside query results, so the dashboard knows that 3500 in the execution_duration column should display as "3.5s", not as the raw number. The query engine isn't just returning data; it's returning instructions for how to present it.
Allowed values
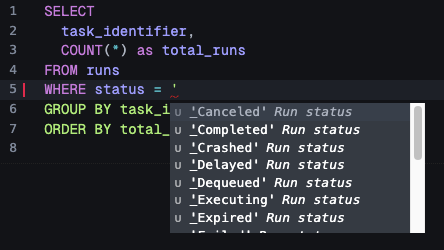
Columns like status, machine, and environment_type declare their valid values directly in the schema:
status: {
name: "status",
allowedValues: ["Completed", "Failed", "Crashed", "Queued", ...],
// ...
}
These allowed values serve multiple purposes: the query editor uses them for autocomplete suggestions, the AI assistant uses them to generate valid queries, and the schema validator rejects queries that filter on values that don't exist.
Custom functions
TRQL includes functions that don't exist in ClickHouse. These are expanded during compilation into their ClickHouse equivalents.
timeBucket()
The most important custom function. timeBucket() automatically selects an appropriate time interval based on the query's time range. You use it like this:
SELECT
timeBucket(),
COUNT(*) as runs
FROM runs
GROUP BY timeBucket
ORDER BY timeBucket
The compiler looks at the time range of the query and chooses bucket sizes that balance detail with performance:
| Time range | Bucket size |
|---|---|
| Up to 3 hours | 10 seconds |
| Up to 12 hours | 1 minute |
| Up to 2 days | 5 minutes |
| Up to 7 days | 15 minutes |
| Up to 30 days | 1 hour |
| Up to 90 days | 6 hours |
| Up to 180 days | 1 day |
| Up to 1 year | 1 week |
This matters for three reasons. First, users don't need to think about granularity. A chart that covers the last hour gets 10-second resolution. The same query over 30 days automatically switches to hourly buckets. Second, it prevents queries from returning millions of rows. Without automatic bucketing, a time-series query over a year of data could try to return a row for every 10-second interval. Third, and possibly most importantly, when you add a chart to a dashboard and adjust the time range, the chart will automatically switch to the appropriate bucket size.
prettyFormat()
Schema columns carry rendering metadata automatically (a duration column knows it should display as "3.5s"). But what about computed expressions? If you write SUM(usage_duration), the result is just a raw number with no formatting hint.
prettyFormat() solves this. It takes two arguments: an expression and a format type. The expression is passed through to ClickHouse unchanged, but the format type is attached as column metadata in the response so the UI knows how to render the result.
SELECT
timeBucket(),
prettyFormat(avg(value), 'bytes') AS avg_memory
FROM metrics
WHERE metric_name = 'process.memory.usage'
GROUP BY timeBucket
ORDER BY timeBucket
LIMIT 1000
The available format types are:
| Format type | Renders as |
|---|---|
duration |
Milliseconds as human-readable time (e.g. "3.5s", "2m 15s") |
durationSeconds |
Seconds as human-readable time |
costInDollars |
Dollar formatting with appropriate precision |
cost |
Generic cost formatting |
bytes |
Byte counts with binary units (KiB, MiB, GiB) |
decimalBytes |
Byte counts with decimal units (KB, MB, GB) |
quantity |
Large numbers abbreviated (1.2M, 3.4K) |
percent |
Percentage formatting |
This is the same rendering system that powers the schema's customRenderType, but available for any expression you write. The dashboard widgets use it to display computed values with the right units.
ClickHouse functions
TRQL doesn't try to reinvent standard analytical functions. ClickHouse aggregations like quantile(), countIf(), avg(), sum(), and round() are all available directly and passed through to ClickHouse unchanged. TRQL only adds custom functions when it needs behavior that ClickHouse can't provide on its own.
The editor experience
The query editor in the Trigger.dev dashboard is built on CodeMirror 6 and uses a dual-parser architecture.
Two parsers, one editor
Syntax highlighting and linting are handled by two completely different parsers:
For highlighting, we use CodeMirror's built-in Lezer grammar with the StandardSQL dialect. Lezer is an incremental parser, meaning it only re-parses the parts of the document that changed. This makes it fast enough to run on every keystroke without any perceptible lag. It tokenizes the text into syntax nodes (keywords, identifiers, strings, numbers, operators) and our custom theme maps these to colors.
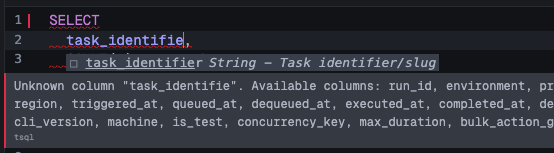
For linting, we use the full ANTLR4-based TRQL parser. Every edit (debounced by 300ms) runs the complete TRQL pipeline: parseTSQLSelect() produces a full AST, then validateQuery(ast, schema) checks it against the table schemas. This catches unknown columns, invalid table names, and type mismatches and shows them as inline diagnostics.
Why two parsers? Lezer is fast but doesn't understand TRQL-specific semantics like virtual columns or allowed values. ANTLR understands everything but is too heavy to run on every keystroke for syntax coloring. Using both gives us the interactive responsiveness of Lezer with the correctness guarantees of ANTLR.
Schema-powered autocomplete
Autocompletion is entirely custom. We don't use CodeMirror's built-in SQL completion. Instead, the completion source analyzes the cursor position and the surrounding query text to determine context:
- After
FROMorJOIN: show table names - After
SELECT,WHERE,GROUP BY,ORDER BY: show columns from the tables referenced in the query, plus functions - After
tableName.: show columns for that specific table - After a comparison operator like
=orIN (: showallowedValuesfrom that column's schema definition
This is where the schema really pays off. When you type WHERE status = ' the editor immediately suggests Completed, Failed, Crashed, and the other valid status values, because the schema declares them. The same allowedValues arrays that power validation also power autocomplete.
If you reference a column that doesn't exist, the linter catches it immediately and shows an inline error:
The data flow
Every keystroke flows through three independent paths:
- Lezer parser (immediate): tokenizes the SQL, applies syntax highlighting
- Completion source (on trigger): analyzes cursor context, returns schema-aware suggestions
- ANTLR linter (300ms debounce): full parse and validation, produces error diagnostics
The TableSchema type is the glue that connects all three. It defines table names for FROM suggestions, column definitions for column suggestions, allowed values for enum completion, and validation rules for the linter.
Limits
We enforce several limits to keep the system healthy for all users. Each one exists for a specific reason:
- Concurrency limit: We limit the number of concurrent queries per organization. Without this, a single org running expensive queries in a loop could monopolize the ClickHouse cluster and degrade performance for everyone else.
- Row limit: Results are capped at 10,000 rows. We actually request 10,001 from ClickHouse so we can tell the user "there are more results" without returning an unbounded dataset.
- Time restrictions: Every query is bounded to a maximum time range. Without this,
SELECT * FROM runswould attempt a full table scan across the entire history. The allowed range varies by plan. - Query resource limits: We cap the memory a query can use, the wall-clock time it can run, and the AST complexity. The AST complexity limit prevents deeply nested subqueries that could produce exponential query plans in ClickHouse.
What's next
TRQL is the foundation for everything we're building in observability. The same language powers the dashboard widgets, the SDK's query.execute() function, and the REST API. As we add more data to the system, we can expose it through new tables without changing the query language or the compilation pipeline.
If you haven't tried Query & Dashboards yet, every project already has a built-in dashboard waiting for you. Head to your Trigger.dev dashboard to try it out.
Read the companion post: Query & Dashboards: analytics for your Trigger.dev data