Last month I posted about my journey migrating my site server from an old Ubuntu server to FreeBSD. Some people on Hacker News noticed that, when I showed the fastfetch result, I said I was confused with the RAM usage compared to btop and commented that fastfetch is probably more correct. I decided to enter that rabbit hole and try to understand why reporting free or used memory in a modern operating system is more complicated than it seems.
Another user shared Linux ate my RAM, which provide a quick explanation for the same effect on Linux. And if you want a quick answer for FreeBSD too: the usage sometimes look off because the OS will cache everything it can from the disk into the RAM to improve overall performance, but that cache is volatile and will be freed in case it needs more memory. If you want a slightly longer answer, keep reading.
But just a quick disclaimer before: I am not an expert in operating systems internals, especially FreeBSD. This is a writeup of weeks of research in this field on my free time. If you find anything that’s particularly wrong, please comment it: sharing (knowledge) is caring!
RAM usage is hard to define
The whole point of Linux ate my RAM is explaining how unused RAM is wasted RAM. Just like the CPU cache will cache RAM contents because the CPU can access that quicker, the RAM will cache disk data to improve the user’s experience in the system. How that cache works is a bit more complicated, but before that, it’s important to understand how the kernel manages RAM.
Most modern operating systems have a Virtual Memory (VM) system. What it does is basically divide the physical memory into pages of (usually) 4KiB. Each page is then added to different queues, so that the kernel can juggle them around to make sure all the processes have their memory when they need and the whole system will keep working through moments of scarcity. For example: the swap memory. I never thought exactly how the Swap memory was used, except that it’s a space separate in disk that will store temporarily part of the RAM if needed. But in summary, when the OS sees allocated RAM that’s not being used too much, it will set it in a way that it can be stored in disk in case more memory is demanded. When those pages are requested again by the program that owns it, it will then get moved back into RAM.
Every OS has a different set of pages and rules for how to manage them. On FreeBSD, the types of page queues are:
#define	PQ_NONE		255
#define	PQ_INACTIVE	0
#define	PQ_ACTIVE	1
#define	PQ_LAUNDRY	2
#define	PQ_UNSWAPPABLE	3
#define	PQ_COUNT	4
You can find that at sys/vm/vm_page.h. All other unix-based systems will have something similar: Linux, OpenBSD, NetBSD, DragonFlyBSD.
If we check top, we see that it doesn’t just report memory usage, but divides it into a few categories:
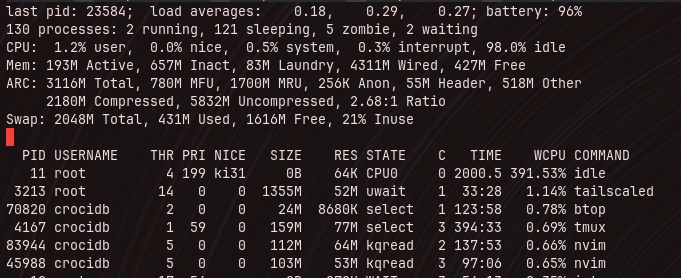
top reports each section of memory, swap and disk cache with a lot of details
- active: active pages are pages that are actively being used by (mostly) userland processes
- inactive: pages that haven’t been accessed by those process in some time will be moved into inactive
- laundry: this is the queue of pages to be written to swap. When the system needs to allocate space that is not in the free queue, it will move inactive pages to this queue
- wired: that’s memory in
PQ_NONE,PQ_UNSWAPPABLEand memory that the kernel itself is using and is not managed by the VM - free: purely unused memory
When memory that was inactive, went to laundry, got written to disk (swap), is requested again by the process that owns it, it will then get retrieved from the disk into inactive and finally to active again.
And now we can start to see why it’s not so easy to tell exactly how much memory is being used and how much is free. Memory in the free queue is guaranteed to be free, but we can argue that the one in the inactive queue is too, since it’s reclaimable, because the kernel will free that whenever more memory is demanded. Wired memory is mostly locked, however, that’s where disk cache goes, so part of what’s in wired is also reclaimable, making it “free” too!
Disk Cache
ZFS, the default FreeBSD filesystem nowadays, has ARC, Adaptive Replacement Cache, a specialized system that caches recently used data in memory, improving the repeated reading from disk. That cache shrinks as the system claims more memory. The kernel itself has mechanisms to do this cache, but ARC bypasses that. All the stats from that can be accessed via the kernel parameters kstat.zfs.misc.arcstats.*. Using sysctl, we can fetch it all:
sysctl kstat.zfs.misc.arcstats
This will show literally all the parameters available, but now just these are important:
sysctl -n kstat.zfs.misc.arcstats.size
sysctl -n kstat.zfs.misc.arcstats.c_min
sysctl -n kstat.zfs.misc.arcstats.c_max
These will show the current cache as well as the minimum and maximum configured, all in bytes. Using gnumfmt we can convert to readable units:
$ sysctl -n kstat.zfs.misc.arcstats.size | gnumfmt --to=iec
3.1G
That’s also shown in top, with even more details.
That’s for ZFS, but you can run other filesystems on FreeBSD.
Why fastfetch and btop report differently?
Now we get to the interesting part. Both of these tools, and many others such as htop, try to report the memory usage so the user (or sysadmin) can have an idea of what’s going on with their systems. For that, they all have to pick a heuristic; effectively decide what they’ll call used memory. And the whole difference comes from the fact that they have different heuristics.
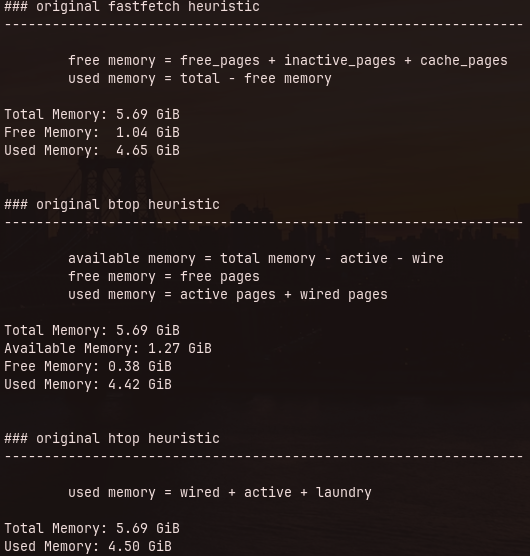
I digged into the source code of each tool to go after how they determine that. fastfetch does this:
free memory = free + inactive + cache*
used memory = total - free memory
More on that
cachelater!
In my old ThinkPad X230, running FreeBSD 15.0-RELEASE, that looks like:
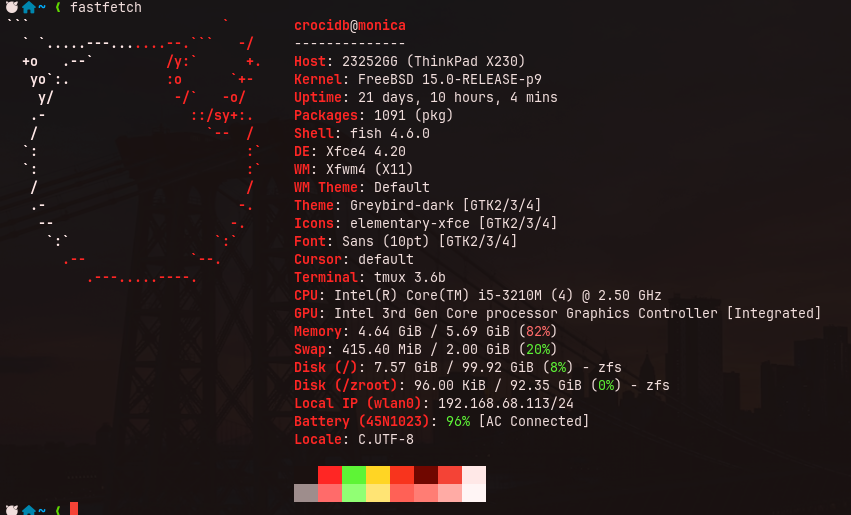
82% of used memory!
btop, on the other hand, does:
available memory = total memory - active - wired
free memory = free
used memory = active + wired
Running it at the same time as fastfetch was giving me this:
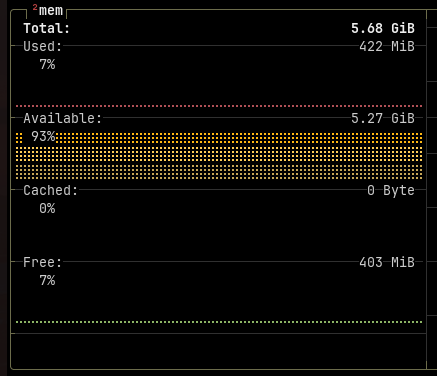
Only 7% used?!
And just to make things even more interesting, I checked htop too, and while it reports the memory categories separately in those bars, it shows the used memory at the end of the bar:
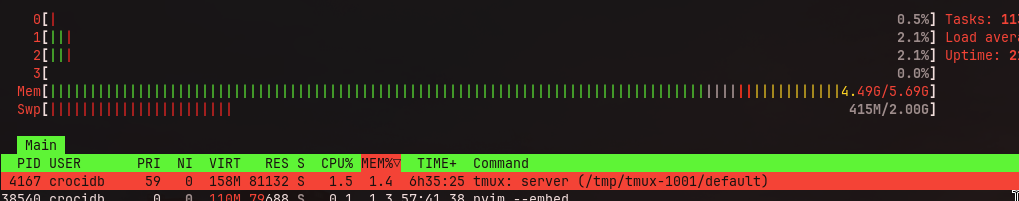
4.49G/5.69G
Using this heuristic:
used memory = wired + active + laundry
Then I wrote a python script that would show me all the heuristics at once. You can find it here.
Pastedimage20260701215700.png
It looks correct, except for btop, that’s way off. But if you’re looking close, you also noticed that the cache value in the screenshot I shared earlier is also empty. It seriously took me weeks to realize that. So I started digging further into their code.
btop memory reporting is pretty wrong on FreeBSD
On their source-code, looking specifically on src/freebsd/btop_collect.cpp, where it fetches the memory information:
int mib[4];
u_int memActive, memWire, cachedMem, freeMem;
size_t len;

len = 4; sysctlnametomib("vm.stats.vm.v_active_count", mib, &len);
len = sizeof(memActive);
sysctl(mib, 4, &(memActive), &len, nullptr, 0);
memActive *= Shared::pageSize;

len = 4; sysctlnametomib("vm.stats.vm.v_wire_count", mib, &len);
len = sizeof(memWire);
sysctl(mib, 4, &(memWire), &len, nullptr, 0);
memWire *= Shared::pageSize;

mem.stats.at("used") = memWire + memActive;
mem.stats.at("available") = Shared::totalMem - memActive - memWire;

len = sizeof(cachedMem);
len = 4; sysctlnametomib("vm.stats.vm.v_cache_count", mib, &len);
sysctl(mib, 4, &(cachedMem), &len, nullptr, 0);
cachedMem *= Shared::pageSize;
mem.stats.at("cached") = cachedMem;

len = sizeof(freeMem);
len = 4; sysctlnametomib("vm.stats.vm.v_free_count", mib, &len);
sysctl(mib, 4, &(freeMem), &len, nullptr, 0);
freeMem *= Shared::pageSize;
mem.stats.at("free") = freeMem;
It uses sysctl (which is in FreeBSD’s libc) and fetches the number of pages for each queue straight from vm.stats.vm.*. For active it uses vm.stats.vm.v_active_count, wired is vm.stats.vm.v_wire_count, cool. Then it processes the amount of bytes by multiplying the amount of pages in those queues by Shared::pageSize. There’s one issue, though. It stores the data in memActive, which is a u_int, an unsigned 32bit integer. Without doing much math, I remembered when we switched to 64bit CPUs, one of things I heard the most was: “now you can have more than 4 gigs of ram”.

My next tattoo right there!
Well, we’re talking about an unsigned 32bit integer, so it’s 4,294,967,295. If you get 4GiB in bytes, that’s 4,294,967,296. That means that anything above that value will wrap. Looking at my script’s output for used memory in btop, 4.42 GiB and btop’s output of 422 MiB, it’s pretty clear it’s wrapping.
Empty Cache Issue
Another thing that I did not realize at first when I wrote my post about migrating my blog server to FreeBSD was that the Cached memory bucket was empty. To test it further, I created two virtual machines with FreeBSD 13.5-RELEASE and 15.1-RELEASE, using ZFS and UFS filesystems respectively, additionally to my laptop running 15.0-RELEASE with ZFS.
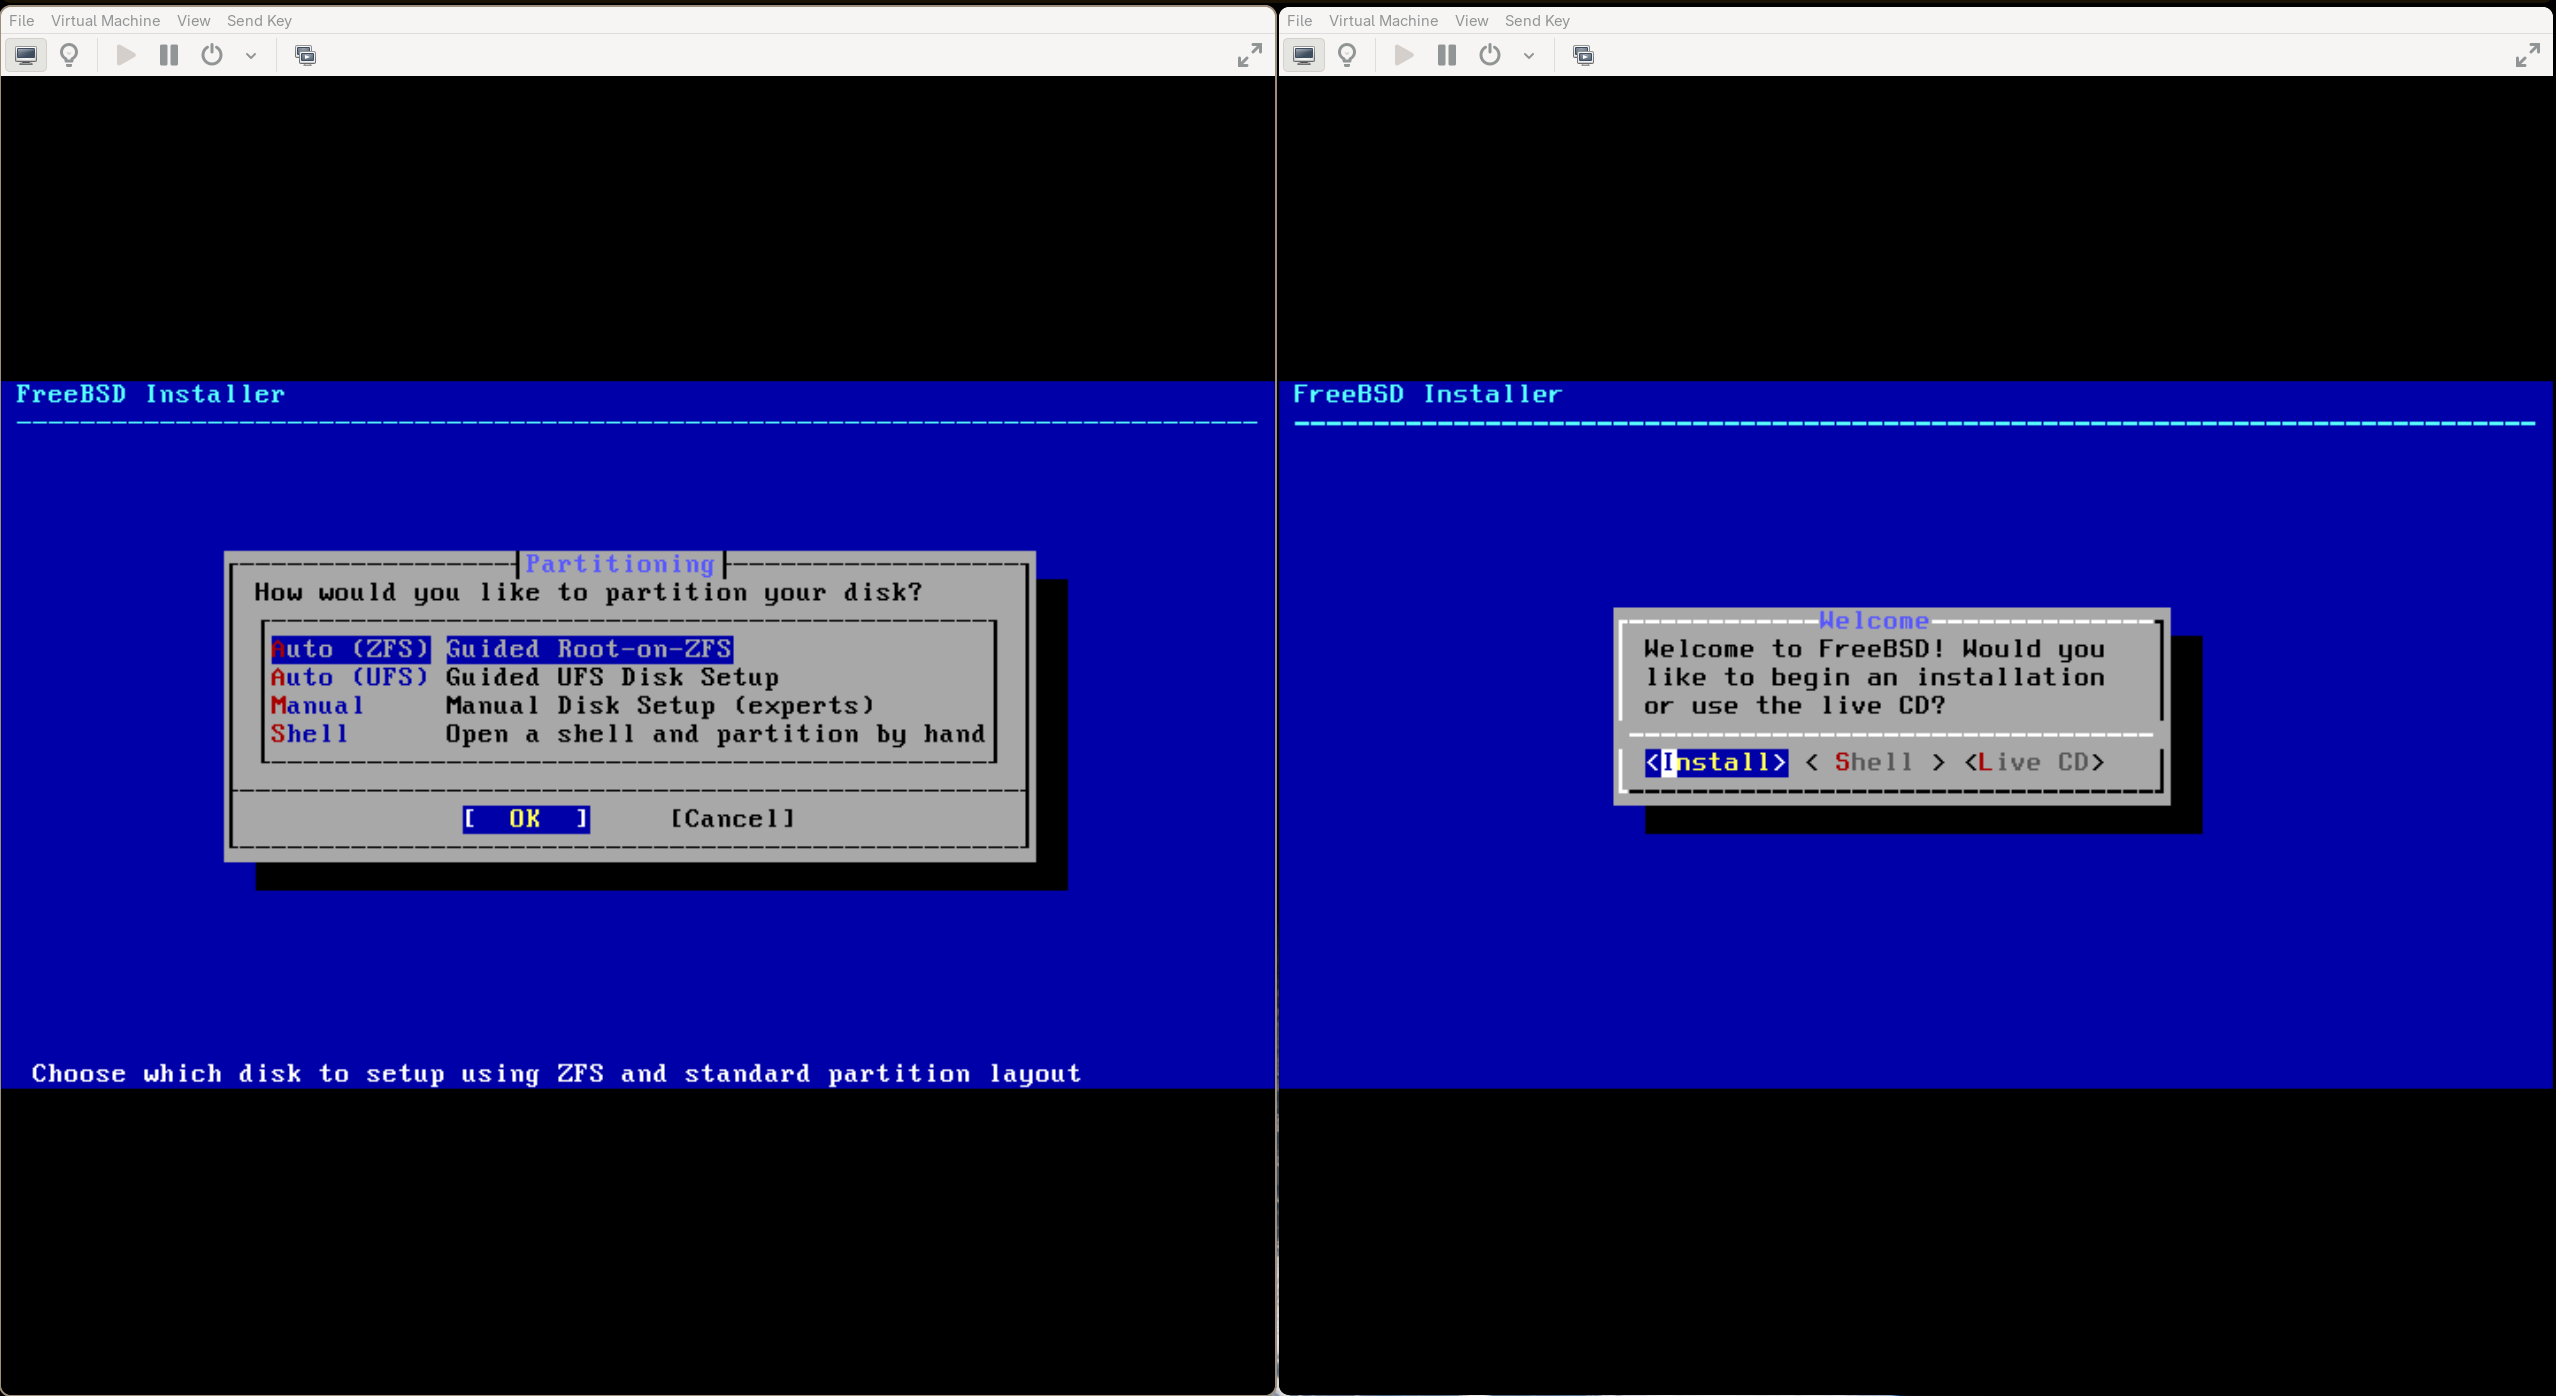
I installed FreeBSD over 10 times this last month, I think I might be able to follow the installer with my eyes closed
After installing btop (along with other tools) from pkg, I started testing:
I tried different filesystems to check if I was missing something on non-ZFS systems
In both, we can see that the Cached bucket is empty.
In the detection code, it’s fetching information from vm.stats.vm.v_cache_count:
len = sizeof(cachedMem);
len = 4; sysctlnametomib("vm.stats.vm.v_cache_count", mib, &len);
sysctl(mib, 4, &(cachedMem), &len, nullptr, 0);
cachedMem *= Shared::pageSize;
mem.stats.at("cached") = cachedMem;
When I tried to fetch that myself with sysctl:
$ sysctl -n vm.stats.vm.v_cache_count
0
I learned that -d will show the description for each parameter, which turned out to not be very useful since most parameters are not documented. But v_cache_count specifically is:
$ sysctl -d vm.stats.vm.v_cache_count
vm.stats.vm.v_cache_count: Dummy for compatibility
Yep, it returns 0 because it’s some legacy code. In fact, FreeBSD reports “Dummy for compatibility” since version 12.0! We can check the difference in the description for v_cache_count (in sys/vm/vm_meter.c) for FreeBSD 12.0:
#ifdef COMPAT_FREEBSD11
/*
 * Provide compatibility sysctls for the benefit of old utilities which exit
 * with an error if they cannot be found.
 */
SYSCTL_UINT(_vm_stats_vm, OID_AUTO, v_cache_count, CTLFLAG_RD,
    SYSCTL_NULL_UINT_PTR, 0, "Dummy for compatibility");
SYSCTL_UINT(_vm_stats_vm, OID_AUTO, v_tcached, CTLFLAG_RD,
    SYSCTL_NULL_UINT_PTR, 0, "Dummy for compatibility");
#endif
And the previous version, FreeBSD 11.4:
VM_STATS_VM(v_cache_count, "Pages on cache queue");
But interestingly, cache queue don’t exist since FreeBSD 6.3.0. I installed 11.4 and, although sysctl -d vm.stats.vm.v_cache_count returns that description “Pages on cache queue”, actually fetching the value returns always 0. I also tried 6.3.0 and v_cache_count was also zero. So no idea why.
btop’s usage of v_cache_count is there since the very first FreeBSD build, which was shipped after FreeBSD 12.0, so no idea either how it made it through this far.
Crafting a Fix
Then I started working on a fix. First of all, I doubled the precision of the variables that hold the queue bytes, so no more wrapping issues. Then I thought of how to correctly track filesystem cache. Digging through htop source-code for some guidance, I found this comment:
   // comment by Pierre-Marie Baty <pm@pmbaty.com>
   //
   // FreeBSD has the following memory classes:
   //    active:   userland pages currently mapped to physical memory (i.e. in use)
   //    wired:    kernel pages currently mapped to physical memory, cannot be paged out nor swapped
   //       buffers: subcategory of 'wired' corresponding to the filesystem caches
   //    free:     pages that haven't been allocated yet, or have been released
   //
   // With ZFS, the ARC area is NOT counted in the 'buffers' class, but is still counted in the 'wired'
   // class. The ARC total must thus be subtracted from the 'wired' class AND added to the 'buffer' class,
   // so that the result (ARC being shown in buffersMem) is consistent with what ZFS users would expect.
   // This adjustment is done in Platform_setMemoryValues() in freebsd/Platform.c.
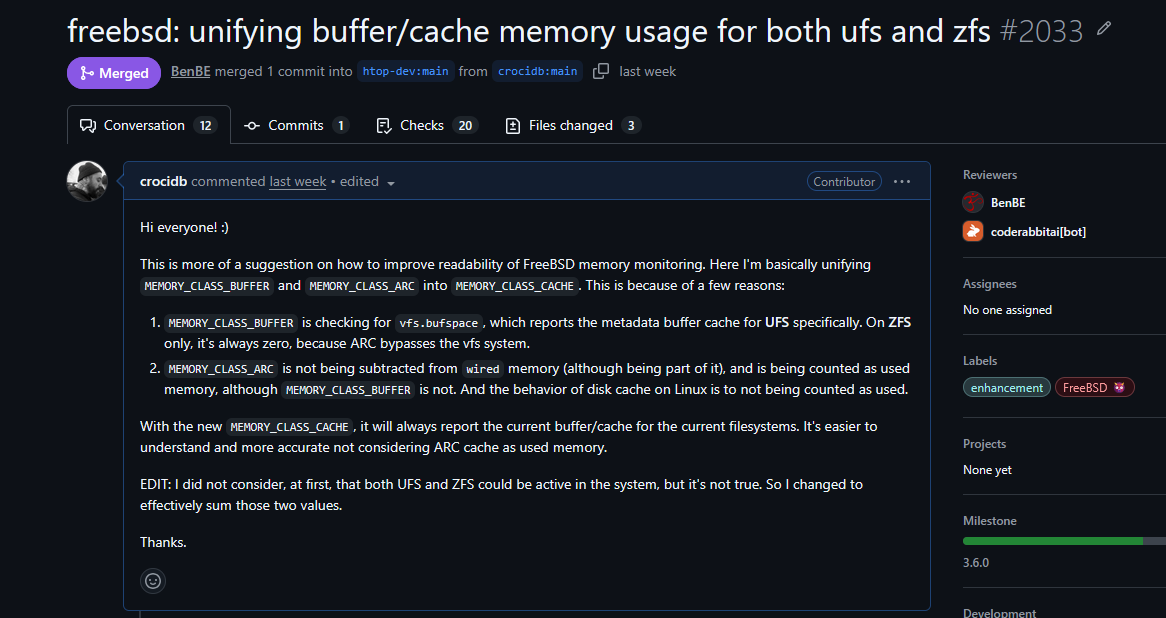
More specifically The ARC total must thus be subtracted from the 'wired' class. That makes sense, but I noticed that it wasn’t doing that. That lead me to write a PR fixing it in htop, along with unifying cache and buffers memory classes. It’s a side-quest of the side-quest, but here it is, the PR has been merged:
vfs.bufspace reports FreeBSD’s own filesystem metadata buffer cache, which is bypassed by ARC
But then now I had a plan on how to proceed with it in btop: basically subtract the variable size of the ARC cache from the wired memory. Also, just like htop, consider vfs.bufspace as reclaimable cache. Here’s the PR. As the time of writing, it hasn’t been reviewed or approved yet.
Here’s the code in src/freebsd/btop_collect.cpp that deals with the cache, that’s present in my PR:
// cached
len = 2;
if (sysctlnametomib("vfs.bufspace", mib, &len) == 0) {
    uint64_t bufSpace = 0;
    len = sizeof(bufSpace);
    if (sysctl(mib, 2, &bufSpace, &len, nullptr, 0) == 0) {
        cachedBytes += bufSpace;
    }
}

len = 5;
if (sysctlnametomib("kstat.zfs.misc.arcstats.size", mib, &len) == 0) {
    uint64_t arcSize = 0;
    len = sizeof(arcSize);
    if (sysctl(mib, 5, &arcSize, &len, nullptr, 0) == 0) {
        uint64_t arcMin = 0;
        len = 5;
        if (sysctlnametomib("kstat.zfs.misc.arcstats.c_min", mib, &len) == 0) {
            len = sizeof(arcMin);
            sysctl(mib, 5, &arcMin, &len, nullptr, 0);
        }
        cachedBytes += (arcSize > arcMin) ? (arcSize - arcMin) : 0;
    }
}

// free
len = 4; sysctlnametomib("vm.stats.vm.v_free_count", mib, &len);
len = sizeof(freeMem);
sysctl(mib, 4, &(freeMem), &len, nullptr, 0);

uint64_t activeBytes = (uint64_t)memActive * Shared::pageSize;
uint64_t wireBytes   = (uint64_t)memWire   * Shared::pageSize;
uint64_t freeBytes   = (uint64_t)freeMem   * Shared::pageSize;
uint64_t rawUsed     = activeBytes + wireBytes;
uint64_t usedBytes   = (cachedBytes < rawUsed) ? rawUsed - cachedBytes : 0;

mem.stats.at("used") = usedBytes;
mem.stats.at("available") = Shared::totalMem - usedBytes;
mem.stats.at("cached") = cachedBytes;
mem.stats.at("free") = freeBytes;
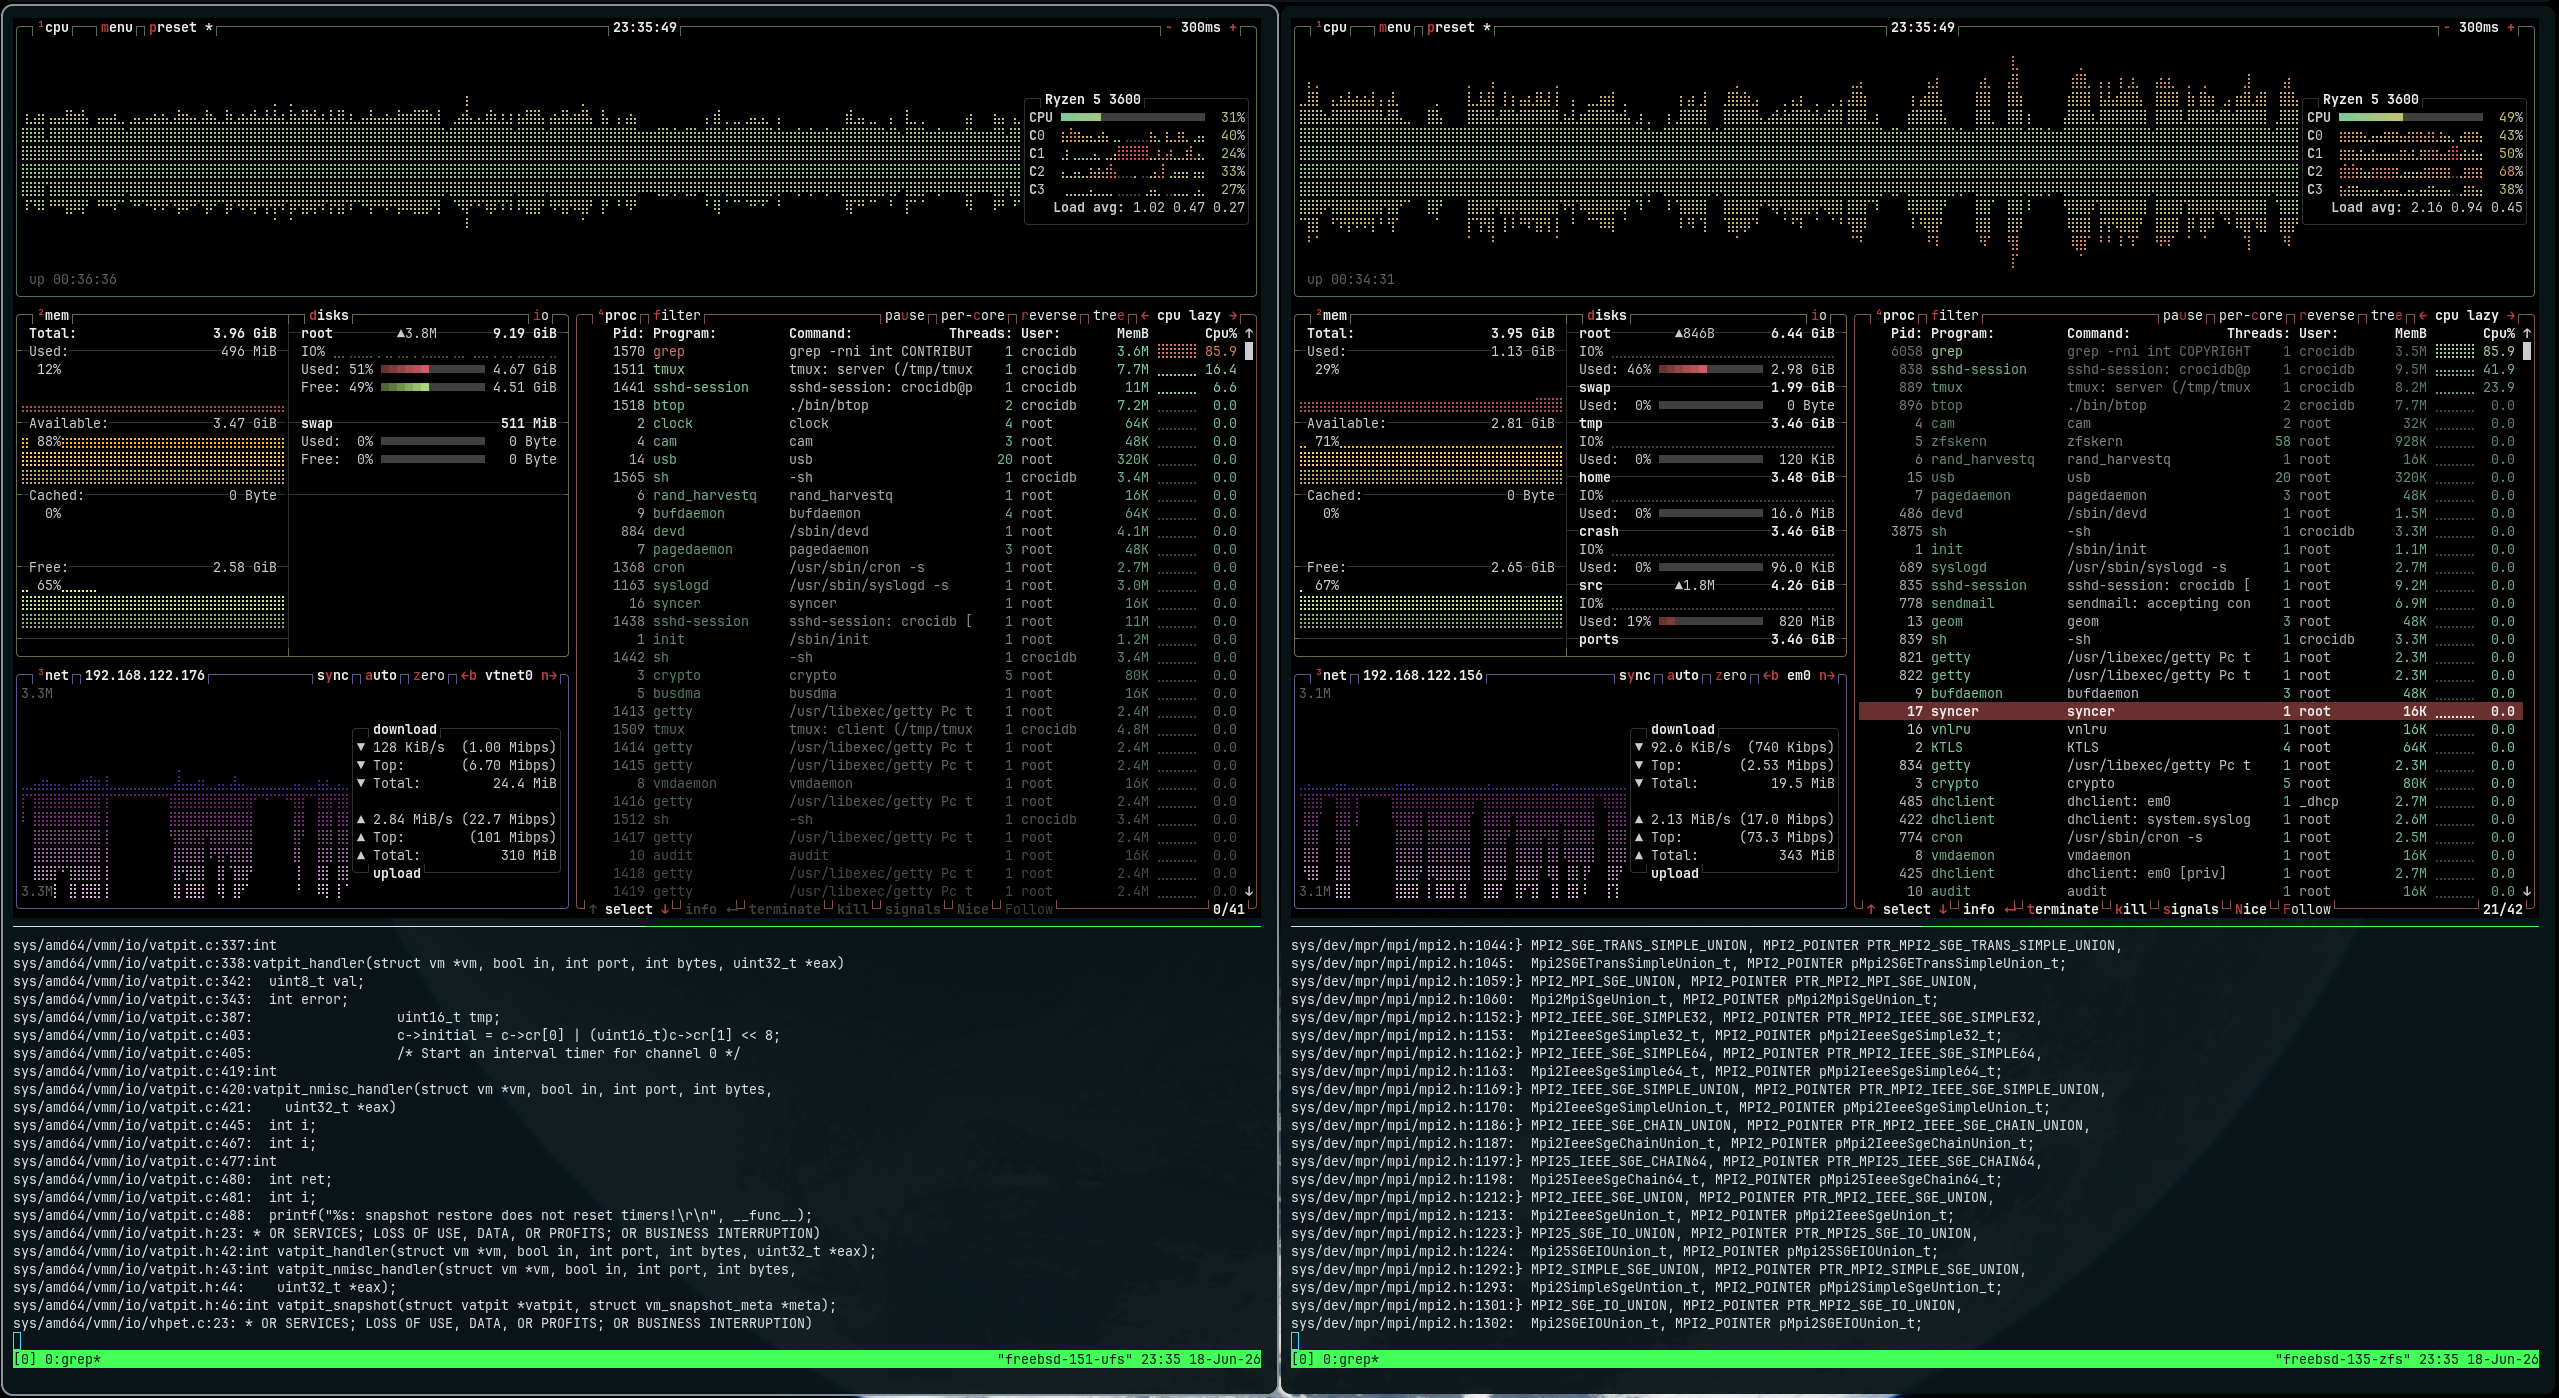
Testing it was also fun. I initially thought that a good way to test the filesystem cache was grep through the system source code (included in /usr/src/) for something like int, which would make it open several thousands of files. I did it in my two VM, watching the output, and it looked like the most “hAcKer” thing ever:
grep -rni int /usr/src/*
But turns out it wasn’t that useful, since the whole src folder is around 1G. So I played with generating a file out of random, then reading it with dd:
dd if=/dev/random of=/tmp/testfile.bin bs=1M count=5000
dd if=/tmp/testfile.bin of=/dev/null bs=1M
And I could see the cache growing vigorously. Then I wrote a quick C program to allocate a lot of memory:
#include <stdlib.h>
#include <string.h>
#include <stdio.h>
#include <unistd.h>

int main() {
    size_t gb_to_allocate = 4;
    size_t bytes = gb_to_allocate * 1024 * 1024 * 1024;
    void *mem = malloc(bytes);

    if (mem == NULL) {
        printf("Failed to allocate memory.\n");
        return 1;
    }

    memset(mem, rand(), bytes);

    sleep(30);

    free(mem);
    return 0;
}
With it I could watch the used memory increase in btop while the cache decreases significantly. Really satisfying.
I feel like this made for a much more precise monitoring of a FreeBSD machine’s memory usage.
The case with fastfetch
fastfetch was also fetching data from v_cache_count. So I went there and applied the same idea of using ARC cache in it and published a PR. Which was closed without any comment. I was confused initially, but then I realized that they applied pretty much the same logic to not only FreeBSD, but all the other systems that support ZFS:
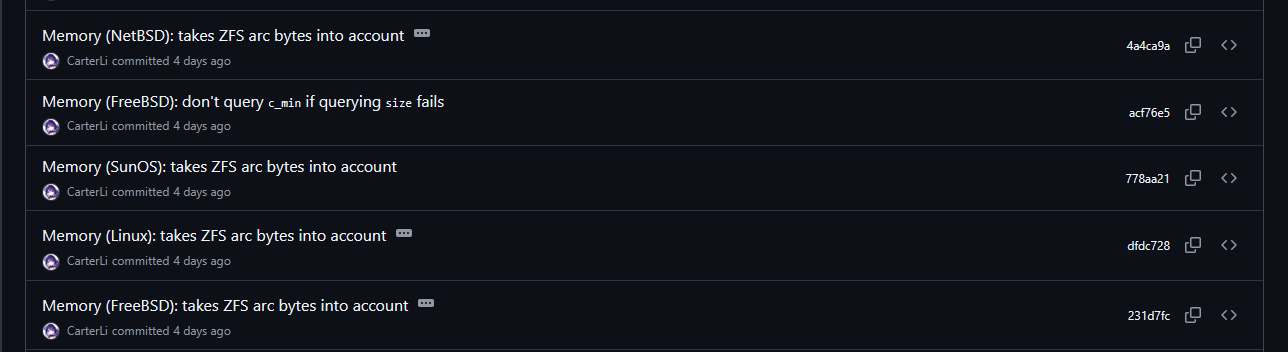
FreeBSD, Linux, SunOS (?) and NetBSD now can detect ARC cache
The final changes to the FreeBSD code had some improvements to my submission, which is great. I just missed some communication of what’s going on. In the end, I’m happy that my contribution had some impact.
In fact, I’m already looking to contributing again, because these changes made into DragonFly BSD, but that flavor of BSD specifically still seems to include cache pages, so the previous solution was likely more correct. I’ll take some time to dig further into that later.
Conclusion
It took me a whole month, since my last post, researching FreeBSD virtual memory internals and installing several versions of the system in virtual machines and I think it brought me closer to this system that any other before. I learned a lot about computers and ended up with three patches for substantial projects.
It also took me back to my young years when I was fascinated with the idea of creating an operating system. I never got past a simple bootloader, but I remember all the time trying to read a pretty bad PDF scan of Operating Systems: Design and Implementation, aka The MINIX book, as a fourteen years old boy who barely read English and had trouble understanding function pointers. The idea of having the whole source code (around 50k lines) for an operating system in a book was mindblowing to me. Although, more modern versions of that book were already available.
Well, now I got myself a copy of the OG. It’s hard to find that first edition, but seems like it’s still being used in India:
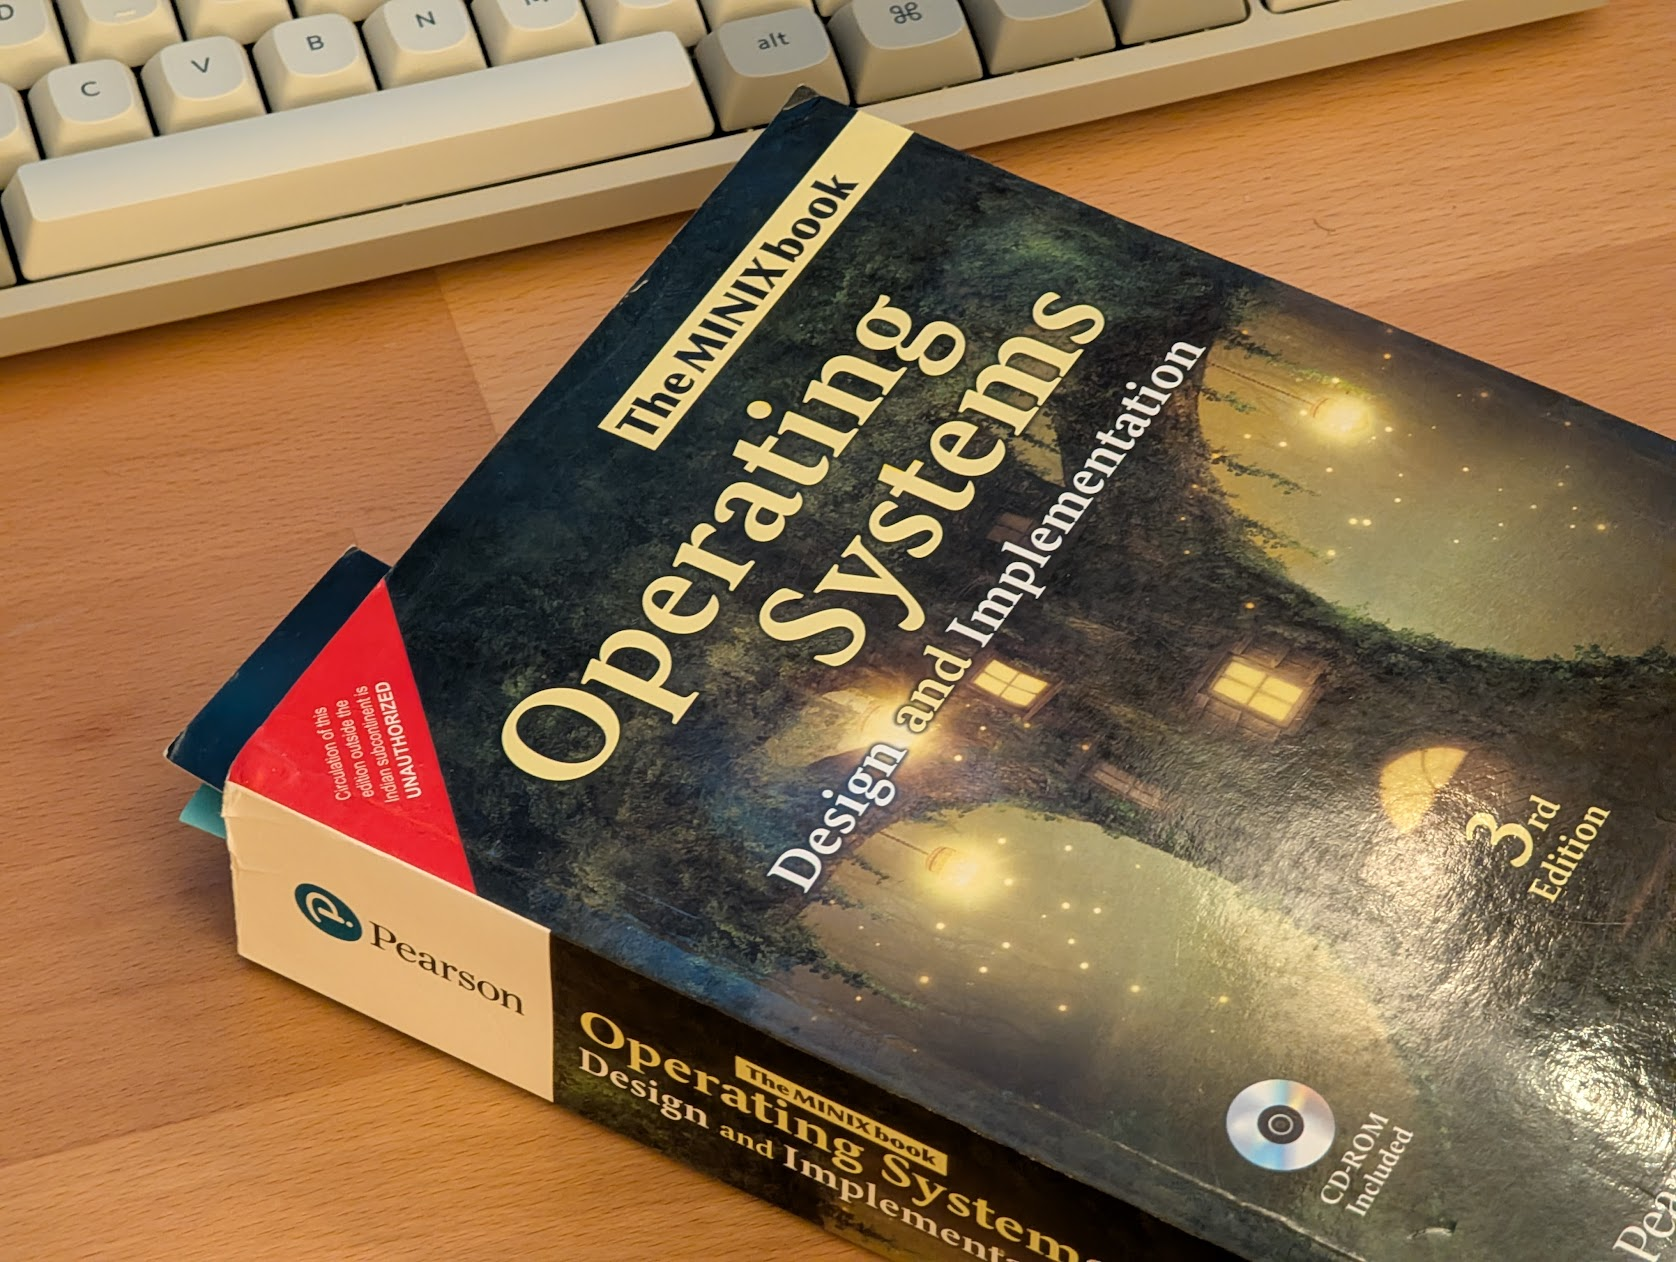
That’s impressive 400 pages of the source-code alone, plus a CD-ROM!
This is funny though:

Unauthorized?